
AI agents are getting better at handling complex, multi-step tasks, but they’re also getting harder to debug. If something goes wrong, knowing a request failed isn’t enough. You need to understand where and why it failed, and what the agent did along the way.
AI agent observability gives you that visibility. This implementation guide will show you how to build it into your agentic AI workflows.
What’s AI agent observability?
AI agent observability captures the full execution of an agent, including model calls, tool invocations, and interactions with external systems. This broader view goes beyond what’s typically covered by LLM observability, allowing engineering teams to investigate failures, troubleshoot unexpected behavior, and improve reliability over time.
Unlike traditional applications, AI agents don’t always follow the same execution path. They make decisions, call tools, retrieve information, and adapt their behavior based on the task at hand, which means the same request won’t always produce the same result. Traditional application monitoring can tell you whether your infrastructure is healthy, but it can’t explain why an agent behaved the way it did.
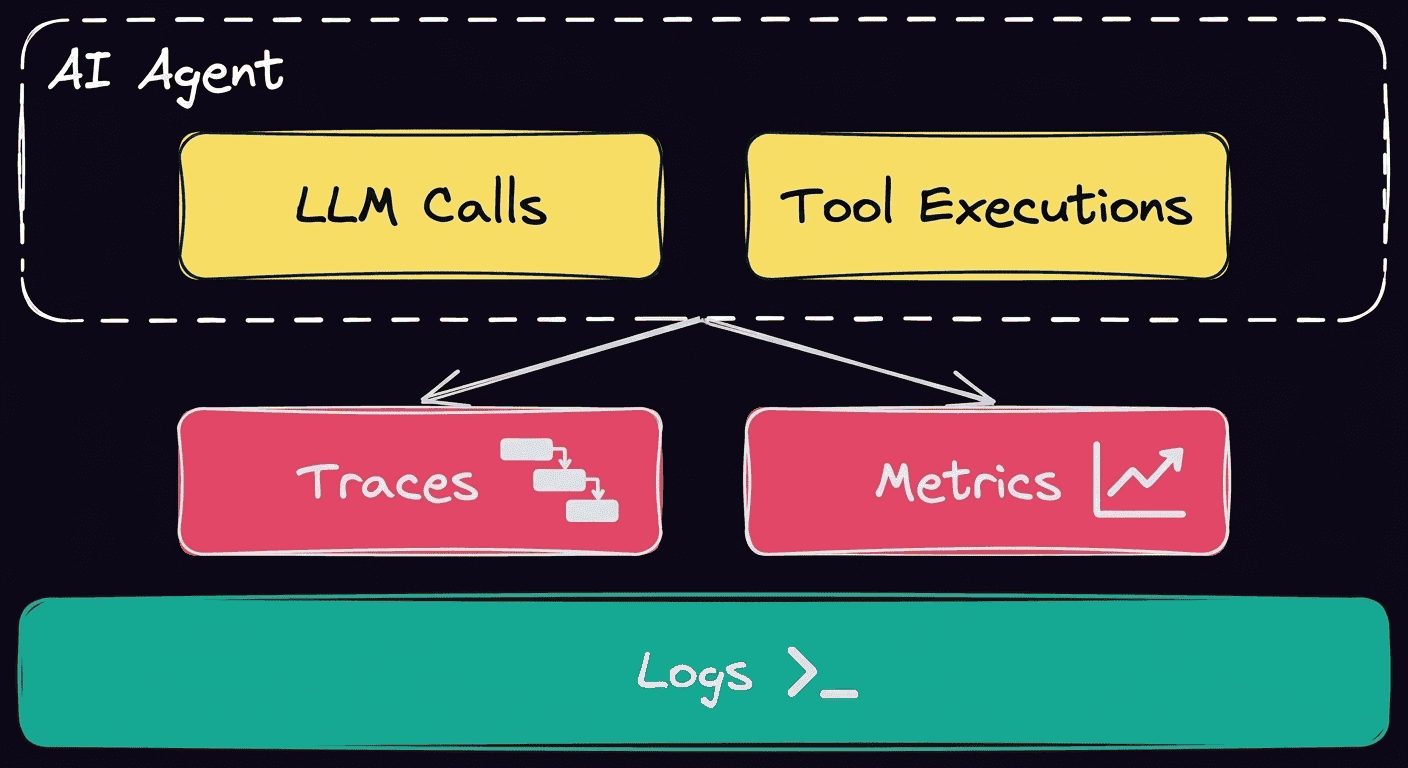
To understand agent behavior, teams usually rely on three types of telemetry.
Traces
Traces show the complete path an agent takes to complete a task. Instead of a single request and response, you see every model call, tool invocation, retrieval step, and decision point that happened along the way. This makes it easier to identify where a workflow broke down, whether it was because of a slow API or an unnecessary tool call. For production AI agents, traces are often the fastest way to understand why two seemingly identical requests produced different results.
Metrics
These help you spot patterns that aren't obvious from individual executions. When you monitor them over time, metrics like latency, token usage, and hallucination rates all become useful signals. A single slow request may not be a concern, but a steady increase in latency or token consumption across hundreds of runs could point to a larger issue. Tracking these numbers also helps engineering teams understand how agent performance changes as prompts and models evolve.
Logs
These provide the detailed context behind each step of an agent's execution. Structured logs capture inputs, outputs, tool responses, errors, and other runtime events. When paired with traces and metrics, logs help answer where something went wrong and what happened at that point in the workflow, reducing the time it takes to diagnose and fix production issues.
AI agent observability tools
Whether you're evaluating dedicated LLM tracing tools or extending your existing observability stack, there are plenty of options available. Here's a quick comparison of some of the most popular AI observability tools:
No matter which observability platform you choose, it only tells part of the story. Production AI agents also need a reliable orchestration layer that makes every workflow execution visible, captures errors, and integrates with the rest of your monitoring stack. That's where platforms like n8n fit in, providing execution history and workflow-level visibility while routing telemetry to dedicated observability tools.
How to implement AI agent observability
Observability for AI agents works best when it's built into your agent architecture from the start. Instead of trying to add AI agent tracing and logging after deployment, plan each stage of your workflow to follow every execution from beginning to end.
Instrument the agent entry point
Every agent execution should begin with a unique identifier that acts as the root span for the entire workflow. That identifier lets you correlate model calls, tool invocations, logs, and downstream services to a single execution, even as the workflow grows more complex.
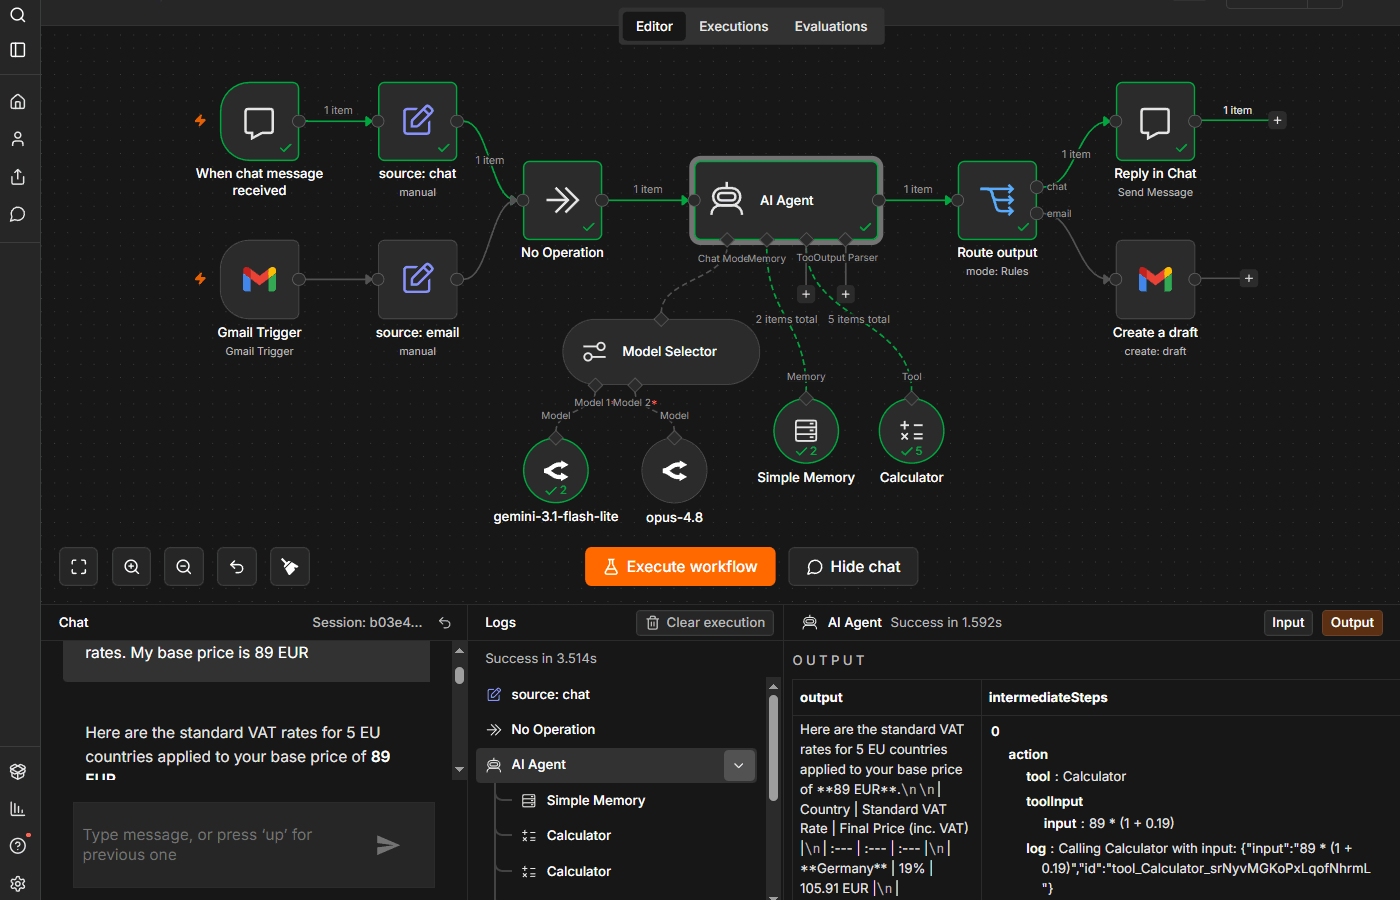
In n8n, every workflow execution has a unique execution ID. You can pass that ID to downstream services through the HTTP Request node or via OpenTelemetry as a trace or correlation header, making it easier to reconstruct an execution across multiple systems.
Create child spans for every model and tool call
Once an agent begins executing, the platform should treat each LLM invocation, retrieval step, API request, and tool as its own span within the larger execution trace. This creates a complete picture of how the agent reached its final output.
Without this level of instrumentation, a failed execution often looks like a single error. With child spans in place, you can quickly identify where issues came from, whether a slow model response, a failed API request, or an unexpected tool call.
Stream structured logs in real time
Capture structured log events for prompts, responses, tool outputs, and errors to gain deeper context and make production issues easier to investigate.
n8n automatically records node-level execution data, so you can quickly inspect workflow inputs and outputs. You can also use the built-in log stream feature to send events to platforms like Datadog Logs, Grafana Loki, or cloud storage for long-term analysis as part of a broader AIOps workflow.
Propagate trace context across services
Production agents rarely stay within a single application. A workflow may call external APIs, trigger asynchronous processes, or hand work off to other services before returning a response.
Passing the same trace context between steps keeps the execution connected across every stage of the workflow. Without that context, observability data becomes fragmented, making it much harder to understand what happened during a single agent run.
Configure error workflows and alerting
Observability isn't just about debugging after something breaks. It should also help you detect problems before they affect users.
Configure alerts for issues like unusually high latency, excessive token usage, and failing tool calls. In n8n, Error Workflows automatically trigger notifications or recovery workflows whenever an execution fails, helping engineering teams respond faster while reducing manual intervention. Users can also add logic branches with a fallback for a fine-grained report.
Observability best practices
Once your observability pipeline is in place, a few simple practices help you troubleshoot agents in production:
- Set sampling rates early: Define a sampling strategy before deploying to production to capture enough detail without overwhelming your observability platform.
- Separate evaluation from observability: Observability tells you how an agent behaved. Evaluation tells you whether it behaved well. Treat these practices as complementary, not interchangeable.
- Track token usage over time: Token consumption isn't just a cost metric. Unexpected increases can indicate prompt changes, inefficient tool use, and workflows that are becoming more complex than intended.
- Check execution data regularly: Reviewing traces, logs, and metrics over time makes it easier to spot recurring failures and opportunities to improve agent behavior.
Build AI agent observability into your workflows
AI agent observability should start long before the first production incident. By instrumenting every workflow, capturing structured execution data, and monitoring AI agent behavior over time, you'll be able to troubleshoot issues faster and build more reliable AI systems.
n8n puts that architecture into practice. Built-in execution logs and Error Workflows provide visibility into every workflow run, while the HTTP Request node makes it easy to integrate with your existing observability stack. Whether you deploy in n8n Cloud or self-host, you can build production-ready AI workflows without sacrificing visibility into how they run.
Explore n8n’s configuration docs to learn how to set up logs and metrics, or jump straight into pre-built, production-ready workflow templates.