In traditional software, code either works or it breaks, making it fairly simple to monitor. With LLMs failure is sneakier. An AI agent can execute perfectly while delivering a confident hallucination or a logic error.
LLM observability captures what the model saw, why it decided, and what it returned, turning silent failures into debuggable decision trails. This transitioned AI agents into a reliable production environment. This guide covers what to track, how to spot problems, and how to build observable AI agents in production.
What’s LLM Observability?
LLM observability lets you see the output of your AI model’s reasoning — not just the final response but thought traces, tool calls, intermediate responses, and the execution steps it took to arrive at its conclusion.
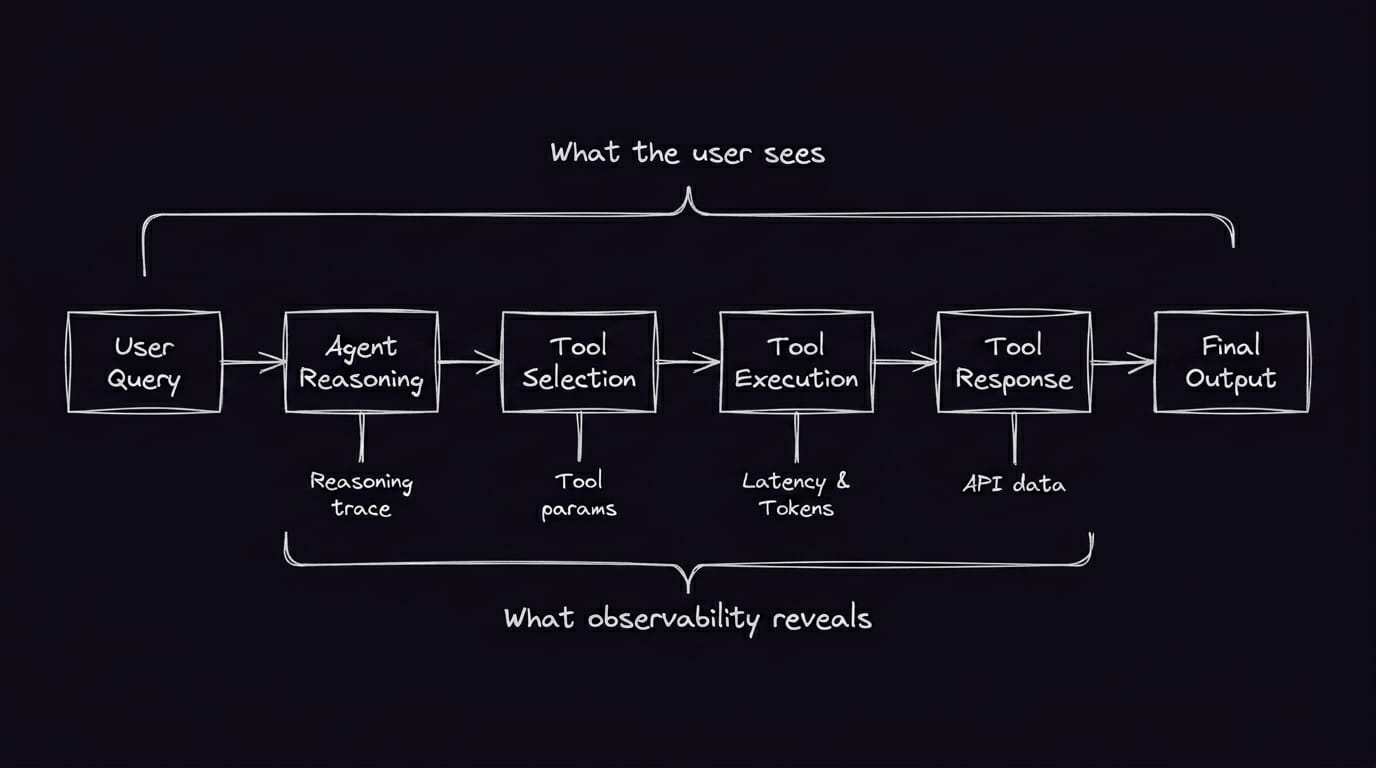
In a standard app, logic is predictable because you wrote it. If a user doesn’t get their data, you can check the database or the API response and find the break. In an LLM, the logic is buried within billions of parameters. An agent might query the right API, receive valid data, but misinterpret the results and recommend the wrong action.
While LLM monitoring tracks symptoms like error rates and latency, observability provides the context to explain why a seemingly healthy model is failing. This not only lets you know that your agent failed but also helps you understand why.
The Data That Drives Observability
To achieve usable LLM observability, you have to instrument the right signals. Here’s what turns raw logs into actionable insights.
Traces and Spans
These components are the structural foundation of observability. A trace represents the entire journey of a single request, from the moment a user hits "send" to the final completion. Within that trace, you have spans: individual units of work that represent specific operations, like a vector database search, a specific tool call, or the LLM's generation process itself.
This hierarchy helps you isolate latency and logic errors and pinpoint exactly which part of the chain broke. Instead of just knowing a workflow took five seconds to fail, you can review the trace and see a specific span — the retrieval step, for instance — took four seconds or returned irrelevant results.
Metrics
To turn traces into a high-level health overview, you need to track metrics across four key tiers:
- System performance: Monitor performance metrics like throughput (requests per second) and latency markers like time to first token. High performance ensures the experience remains responsive under load.
- Resource and cost: Track token usage and total cost per execution to monitor infrastructure efficiency and prevent budget overruns.
- Output quality: Measure signals like groundedness and relevancy to ensure the model’s logic aligns with your requirements.
- Integration health: Monitor the success rates and response times of external tools and APIs called during a workflow.
The metrics help you identify failure points: which tool caused the hallucination, where is the latency coming from or what’s driving cost spikes. With concrete measurable indicators, you can ultimately see where the agent went wrong.
Many teams adopt OpenTelemetry to standardize trace collection regardless of whether agents are built on custom code or frameworks like LlamaIndex.
LLM Observability Challenges
Since LLMs are non-deterministic, a prompt that worked yesterday might produce hallucinations today, even with no changes to the underlying code. This stochastic nature means you can’t rely on standard unit tests to guarantee behavior. Observing the systems requires a stream of live data because the logic is in the probability of the next token, not the syntax.
The sheer volume of unstructured data also creates a technical hurdle. In a standard application, you monitor structured logs and clear-cut metrics. With LLMs, the most important data is often vague natural language that’s hard to pin down with a boolean. Quantifying these subjective qualities — turning "good enough" into measurable scores — is the core challenge of LLM observability. It adds a layer of complexity, as you’re not just monitoring for uptime but for nuanced accuracy over thousands of unique conversations. The next section covers how teams solve this in production.
Best Practices for LLM Observability Implementation
To make LLM observability actually work in production, you can’t treat it as a secondary logging task. It needs to be a core part of your architecture from day one. Here are the strategies to set up an effective stack:
- Define relevant KPIs: Track metrics beyond latency, and monitor outcomes that matter to your team. This might be the rate of successful task completion or the total cost per resolved customer inquiry.
- Instrument early and often: Start capturing traces during the prototyping phase. If you wait until production to add observability, you'll lack baseline data for comparison.
- Centralize your stack: Whether you’re using open-source or proprietary LLM observability tools or a specialized platform like Arize AI or Datadog, ensure your traces and evals flow into a single platform instead of separate eval dashboards.
- Automate PII redaction and data governance: Keep your data compliant with GDPR, HIPAA, or other regional regulations. For instance, you can use n8n workflows to scrub sensitive information before it reaches your chosen LLM observability platform (i.e.using the Code node or regex-based expressions to strip PII from data before it reaches an AI agent node).
- Enforce automated retention policies: Manage the lifecycle of observability data by automating log cleanup or routing high-priority traces to long-term compliant storage. n8n workflows can automate purging routine data, helping teams comply with security policies.
- Build a feedback loop for prompt engineering: Ensure teams can access data as soon as it’s defined. Identified failures can directly inform the next interaction of system prompts and RAG retrieval logic.
- Score models against benchmarks: Run consistent evals to catch regressions in accuracy or safety that infrastructure monitoring alone would miss. By integrating evals into your CI/CD pipeline, you can treat model updates with the same rigor as code deployments.
With these practices in place, the next question is how to implement them. That depends on your workflow complexity and how much visibility you need
Implementing Observability in Your n8n Workflows
n8n excels at the execution layer — where agent decisions, tool calls, and data transformations actually happen. That makes it a natural point for observability, whether you need basic debugging or full instrumentation.
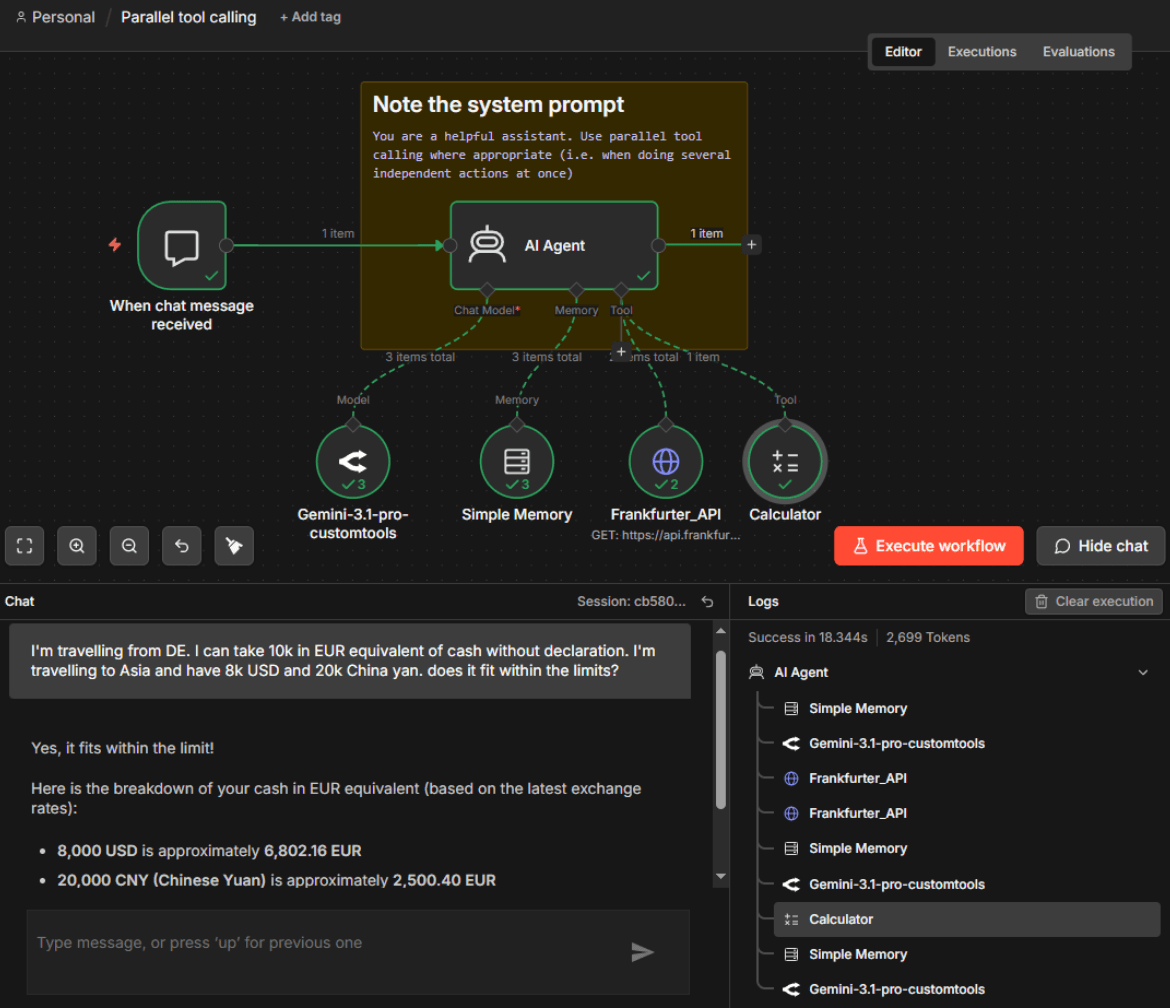
Built-in execution traces
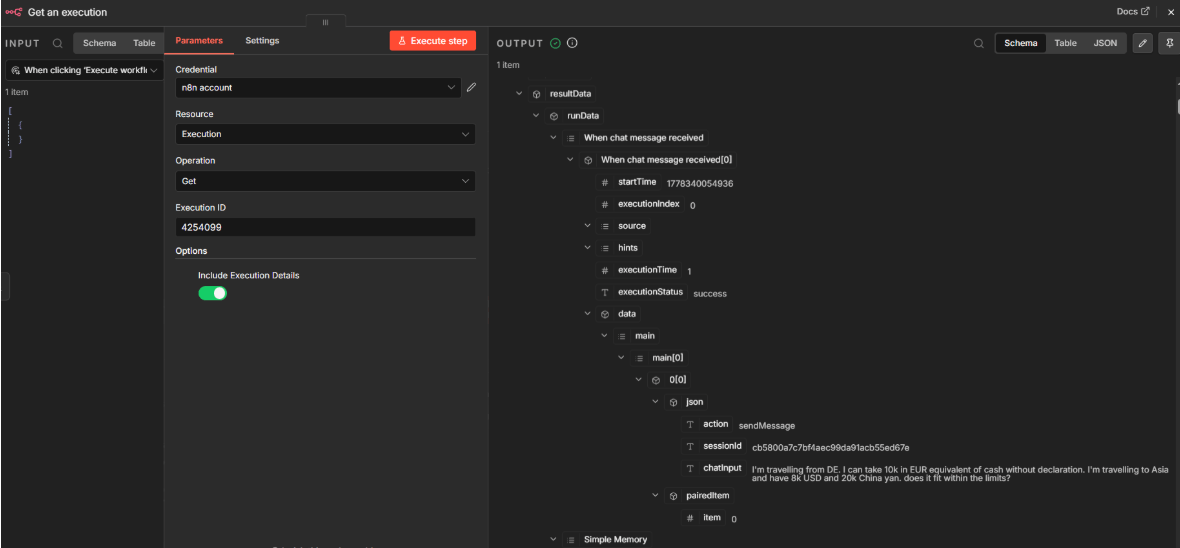
n8n’s LLM monitoring tools tracks every execution step natively — you can inspect which tools the agent called, what inputs and outputs each node produced, and how the agent moved through the workflow. The built-in visibility covers the most common debugging needs without additional tooling.
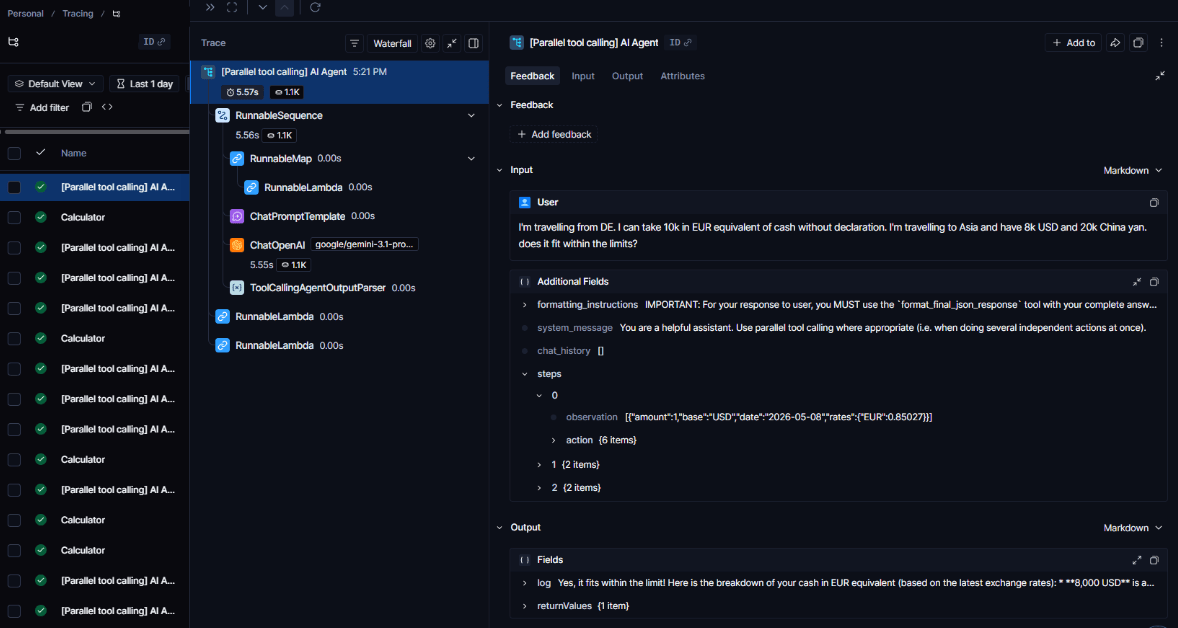
AI Agent Nodes
When you connect an OpenAI model to the Basic LLM Chain or an AI Agent node, n8n can automatically track the execution flow. By connecting these to an observability backend like LangSmith, you gain an immediate window into the spans of your request. This setup lets you see exactly which tools were called and what the thought process looked like before the AI generated the final output. Compared to n8n's native execution logs, these traces provide a more detailed overview, but they require the setup of a dedicated platform.
Automated Post-Processing
n8n doesn’t just collect data — it can act on it. You can build workflows that that trigger on execution completion (via a webhook or polling) to:
- Score the response: Send the output to a smaller, cheaper model to run evals for hallucinations or adherence to official documents.
- Sanitize logs: Strip PII from execution data before it reaches external platforms or storage.
- Alert on anomalies: Send a Slack notification if a request’s latency exceeds a certain threshold or if the token cost for a single execution spikes unexpectedly.
Start Building Your Observability Stack With n8n
Moving AI agents into production requires switching from an “it looks good to me” mindset into a place where you have the data to prove it.
n8n is one of the best LLM observability tools. It gives you built-in execution tracing — see every node execution, tool call, and agent decision in the workflow. This way you don’t need an external platform to get started. Teams using dedicated observability platforms for deeper analysis can configure their n8n instance to automatically send traces from the AI Agent node to LangSmith.
But for most debugging, you don't need to leave n8n. Review exactly where agents fail, what caused hallucinations, which tool calls drove costs — then fix it right where your agents run.
Sign up for free to start building observable AI agents with n8n.