I use information from all over the internet. I visit hundreds of new web pages every day, both for personal and professional projects. It’s part of the process, and I’m happy to do it.
But, every day, I also waste precious time checking the same old websites for other vital information; weather, news, stock portfolio, email, Twitter, work alerts, and so on. And we all have a list like this. And you may find yours just as frustrating.
What annoys me the most is that the second I leave the site, I instantly wonder if the information has changed, and I stress out until I check it out again.
I finally got so fed up with all this chasing after information! Instead of me going to look up information in twenty different places, why can’t this information come to me in one single spot?
And that’s when it hit me 🥊
I Need a Dashboard!
A dashboard makes so much sense! It can contain any information that I want! It can be updated several times a day and can be permanently displayed on a monitor. All I need to do is glance at it for a few seconds, and I know what is going on.
What sealed the deal for me was that most web services can be easily queried with n8n, which can then talk to Smashing, a dashboarding system. Combining these three technologies (web services, n8n and Smashing) would save me significant time every day and keep me better in the loop with what is going on in other areas of my life.
And the best part? You can build your custom dashboard as well!
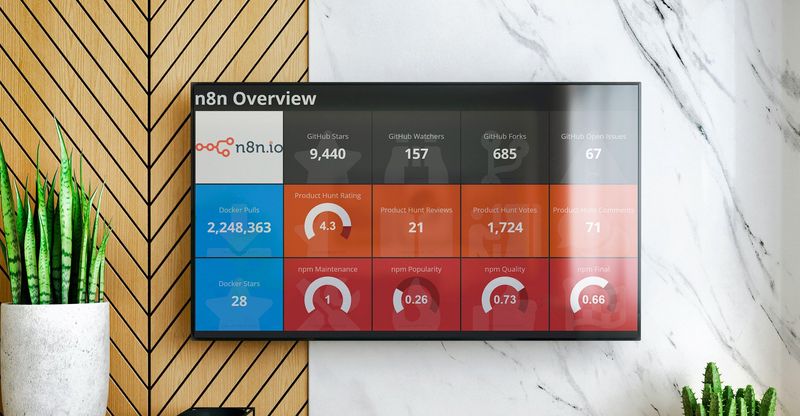
In this article, we will pull information from GitHub, Docker, npm, and Product Hunt about the n8n project and then display it using a Smashing dashboard. Since this information is constantly changing, n8n will perform this every minute. The workflow for this project looks something like this:

n8n and Smashing
The two essential pieces of this project are n8n and Smashing. They make up the core of the project and are very well suited to working together.
Every minute, n8n gathers the data from the four data sources using their API interfaces. It then takes this data and extracts the pieces which are useful and then pushes it to the Smashing dashboard.
At this point, Smashing takes over and displays the information it receives from n8n based on how the dashboard was built inside the Docker container and which Smashing API endpoint receives the information.
How Smashing Works
While it is outside of the scope of this article to go into detail on how Smashing works, it is important for you to understand some of the fundamentals of Smashing.
Each Smashing dashboard is made up of a series of widgets. Each widget displays a piece of information. This information is fed to the widget through the Smashing API. Each widget has its own unique API endpoint. When the endpoint receives information, the widget displays that information.
These are the endpoints that have been created for this project and where their information originates:

This dashboard API interface along with the widget types are defined in the n8n_overview.erb file located in the docker container. (If you are interested in seeing how this file creates the dashboard, it is available here.)
Prerequisites
If you want to build this project yourself, you will need a couple of things ready to go before you start:
- n8n — You can get this up and running by checking out the Quickstart page. You should have a fresh install without any workflows. You can also sign-up for a free n8n cloud trial to get access to our hosted service. This workflow was created in n8n version 0.104.2.
- Docker — To save you time, we have built a Docker container with all of the Smashing pieces pre-configured. This way, you can have this piece running quickly and easily. For more information on setting up a Docker environment, please check out one of these tutorials.
- GitHub Account — In order to ensure that you do not run into issues accessing the GitHub API, you can use your account to increase how frequently you can retrieve information from the API. If you do not have a GitHub account, you can join here and you can learn how to set up your credentials for GitHub in n8n here.
- Product Hunt Account — To use the Product Hunt API, you are required to authenticate with them using your account and a developer token (see “But… I just wanted to run a simple script?” in the Product Hunt API documentation). If you do not have an account with Product Hunt, you can sign up here.
Quick Start
Many of you want to experience the result before committing to a project or already know the majority of what you will be learning in this article. For you, I have put together this Quick Start option. Follow these steps to get up and running quickly. If something is unclear or you want to learn more about how it works, feel free to dig deeper into the sections that follow.
Here are the quick start steps:
- Install the docker container with the following two commands:
docker pull tephlon/n8n_dashboard

docker pull tephlon/n8n_dashboarddocker run --name n8n_dashboard -d -p 8080:3030 --rm tephlon/n8n_dashboard:latest- Copy the n8n workflow from here and paste it into your n8n installation
- Modify the following nodes with your information. I have highlighted them in red in the workflow for easy identification:
- Dashboard Configuration — set value of dashboardHostname to your docker install
- Retrieve Product Hunt Data — set your token value based on your developer token
- Set up your GitHub credentials
- Save and activate workflow
- Browse to port
8080of your docker installation
Now that you have a fully functioning dashboard, let’s take a look at what everything does, and maybe inspire you to tweak this workflow to suit your needs.
The Five Stages of an n8n Workflow
I have noticed in many of the workflows that I create there are five distinct stages that the workflow goes through from start to finish and this workflow is no exception.
- Trigger
- Configuration
- Data Retrieval
- Data Processing
- Action
This is how the dashboard workflow looks broken up into these different stages:

Let’s work through setting up these five stages as they pertain to the dashboard project.
Stage 1 — Trigger
Every workflow has to be told how to start, and this is referred to as the trigger. In this project, we want to update the dashboard with new information every minute. We’ll use the Cron node for that.
Set the Mode parameter to Every Minute. Doing this will run the workflow (you guessed it) every minute.
Now, the workflow knows how and when to run.
Stage 2 — Configuration
The configuration stage is generally a little more defined in my workflows than they are for others. I like to create a Set node with the majority of the configuration options so that they are all in one place (although there are exceptions to this rule which we will cover in a minute). For those of you who have developed in other tools before, you can think of this node as global variables that are available to all other nodes within the workflow.
Not all configuration settings are set at this time for two reasons:
- The value is retrieved in a later stage
- Set node values get copied when exported. If you have sensitive data such as API tokens in a Set node, they would also get exported (which would be bad)
As a convention for myself, I like to color the borders of my nodes red that require configuration, and you will see that I have done this as well for this workflow.
For the configuration of this workflow, we have created a Set node called Dashboard Configuration, which contains several string values. Most of these values can be ignored at this point, but if you want to customize the dashboard to monitor your project, this is where you would make these changes. (More on this later.)
As described in the quick start section, the only change you need to add to the Dashboard Configuration node is to set the dashboardHostname value so that it matches your docker container deployment. This is very specific to your docker installation and deployment of the tephlon/n8n_dashboard container. If your n8n installation is on the same system as your docker installation, this will be localhost:8080.
If docker is on a different system than your n8n installation, this value will be either <docker IP address>:8080 or <docker hostname>:8080. So, if your docker installation is on 192.168.4.25, this value would be 192.168.4.25:8080. You should be able to get this information from your docker admin. (If it turns out that this person is you and you are uncertain about what this value is, I have found a handy YouTube video which may point you in the right direction.)
This node is connected to the previous Cron node so that these values are loaded every time that the workflow runs, and the values are reset if one of them gets accidentally changed by a different node.
Stage 3 — Data Retrieval
In this stage, we are collecting all of the data from the different data sources, often using settings from the configuration stage.
We are using two different types of nodes to collect data, depending on the service. n8n has a built-in GitHub node, so it makes sense to use it for gathering the GitHub data. But, there are no custom nodes for the other three services, so we will use the HTTP Request node to pull information from each service’s API.
The output of the Dashboard Configuration node connects into these four nodes. They then use these settings to know which project to be monitoring.
You will need to change the settings in two nodes for this stage. The GitHub node will need your GitHub credentials to work, and the Retrieve Product Hunt Data node will need your developer token.
You should now have the ability to retrieve all of the raw data provided by these services.
Stage 4 — Data Processing
Now that we have this data, we need to make sure that it is in the proper format. The two challenges that need to be overcome are:
- Large numbers are difficult to read
- Decimal numbers are too long to display properly
To transform these values into something more usable, we will use the Function node. The Function node allows us to write our custom code when a pre-built node may not exist.
A single Function node is added for each service and connected to the output of the nodes created to retrieve the service data.
To add the thousands separator to a value, you reassign the original value with the updated value. The updated value is created by appending the value name with .toString().replace(/\B(?=(\d{3})+(?!\d))/g,","). This tells the system to convert the number to a string and replace every third space between characters with a comma.
For example, to reformat the pull_count from the Docker service, you would enter the following code:
items[0].json.pull_count = items[0].json.pull_count.toString().replace(/\B(?=(\d{3})+(?!\d))/g, “,”);To round a value to two decimal places, we perform a similar action using the parseFloat function and toFixed() method.
So, to round the score.final value from the npm service, use the following code:
items[0].json.score.final = parseFloat(items[0].json.score.final.toFixed(2));Each value that needs to be changed has the appropriate line of code added to its Function node.
Stage 5 — Action
The final stage is the action. This is where the n8n workflow performs an action on something. In this case, the workflow posts a value to the dashboard API for a specific dashboard widget.
For example, to update the number of GitHub Stars on the dashboard, the workflow needs to post the stargazers_count value from the formatted data originally generated by the GitHub node. This is performed using the HTTP Request node, one for each widget.
And that is the final piece! Once the workflow is activated, it will update all of the dashboard widgets every minute with the information it pulls from each service.
Monitoring Your Own Project
The one thing that most people will want to do is modify this workflow to monitor their own project. I have tried to make this easy by putting all of the changes in one the Dashboard Configuration node.
- dashboardHostname (default http://192.168.1.14:8080): This should be the hostname and port of your docker installation. See Stage 2 — Configuration for more details.
- dashboardAuthToken (default n8n-rocks!): Used to authenticate with the Smashing dashboard. There should be no need to change this unless you are playing around with the docker image.
- product_hunt_post_id (default 170391): The post_id of the product that is being monitored at Product Hunt. You can find this number by going to your product page on Product Hunt and clicking on the Embed button. In the embed code, look for
https://cards.producthunt.com/cards/posts/. The number immediately follows this string. - npm_package (default n8n): Name of the n8n package that is being monitored. You can find your project name by searching for your product at https://www.npmjs.com/ and copying the name exactly as it is on the webpage.
- docker_name (default n8nio): Name of the user or organization who owns the docker repo being monitored. Find the repository that you are using at https://hub.docker.com (e.g. jim/nasium). This is the portion of the string before the “/” (e.g. jim)
- docker_repository (default n8n): Name of the docker repo being monitored. Find the repository that you are using at https://hub.docker.com (e.g. jim/nasium). This is the portion of the string after the “/” (e.g. nasium)
- github_owner (default n8n-io): Name of the user or organization who owns the GitHub repo being monitored. Find the repo that you will be monitoring at https://github.com (e.g. jim/nasium). This is the portion of the string before the “/” (e.g. jim)
- github_repo (default n8n): Name of the GitHub repo being monitored. Find the repo that you will be monitoring at https://github.com (e.g. jim/nasium). This is the portion of the string after the “/” (e.g. nasium)
If there are any of these services which you do not wish to monitor, delete the link between that services’ data retrieval node and the Cron node. This will prevent the node from capturing the data and the widgets on the dashboard will remain unchanged.
What’s Next?
We have just touched the tip of the iceberg when it comes to dashboarding. Some other ideas that are possible include:
- Charting stock prices
- Displaying weather
- Aggregating RSS feeds
- Monitoring Twitter feeds
- Showing videos from a YouTube channel
- Company phone activity
- Personnel in/out board
- Fleet vehicle tracking
Our Journey
We’ve covered a lot of ground today. Let’s review what we have accomplished:
- Installed the custom dashboard in Docker
- Set the workflow to run every minute
- Designed a global configuration node to easily manage common variables
- Gathered data from four different online services
- Modified the data so that is displays properly
- Pushed the information for display in the dashboard using its API
I’d love to hear about what you’ve built using n8n! Or if you’ve run into an issue while following the tutorial, feel free to reach out to me on Twitter or ask for help on our forum 💙
Start automating!
The best part is, you can start automating for free with n8n. The easiest way to get started is to download the desktop app, or sign up for a free n8n cloud trial. Thanks to n8n’s fair-code license, you can also self-host n8n for free.


