
I am an experienced statistical programmer and I’ve been working as a freelancer for several years already. I’ve been using n8n for both personal and work use cases, for example to build a multilingual Telegram bot and generate data visualizations with ggplot2.
In my work, I use OnlyOffice cloud software for most of the admin activities: project management, personal knowledge base, time tracking, invoicing, and much more. While OnlyOffice is a great universal “swiss knife” for many companies, its integration between different modules is not optimal, and the possibilities for custom reporting are limited.
As an alternative, recently I have started to generate custom timesheets using the OnlyOffice API and n8n. It’s a great tool for moving data between different services, but it can also be used to generate reports from scratch, thanks to the recently added Markdown node.
In this tutorial, I will walk you through a workflow that prepares a markdown document and converts it to a nice HTML timesheet report, using the Markdown node and a bit of JavaScript.
We will not be using OnlyOffice for that, because it's a specific SAAS tool, but the general principles of creating markdown files are the same.
Table of contents
The use case: generate markdown HTML report
Prerequisites for building the workflow
Building the workflow for generating markdown HTML reports
Getting and processing raw data
Creating a markdown file
Generating an HTML report
What's next?
The use case: generate markdown HTML report
The workflow for generating Markdown HTML reports consists of eight core nodes that accomplish the following tasks:
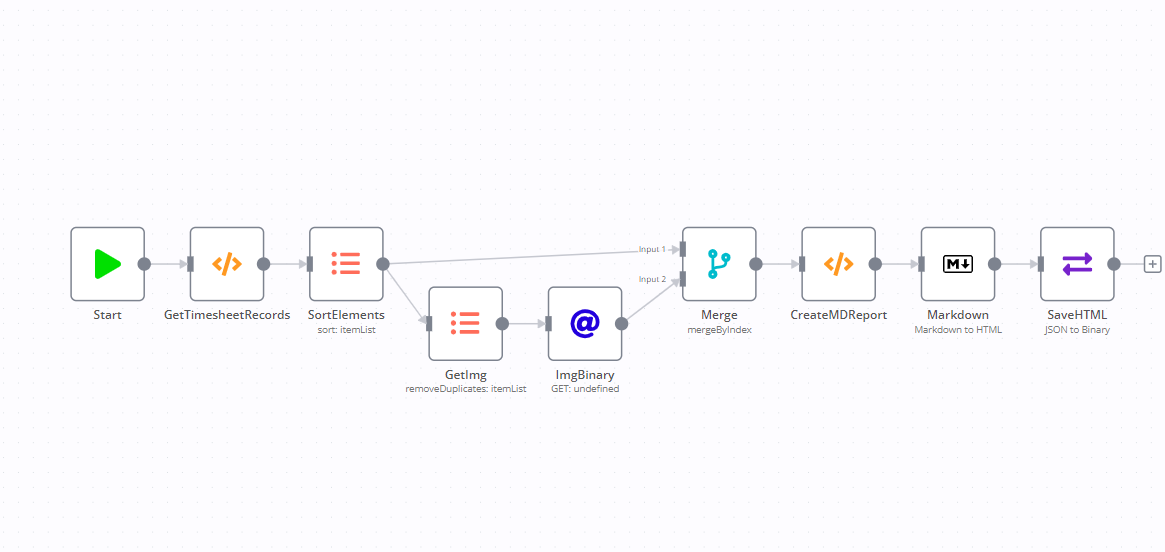
- First Function node contains the mock data for the tutorial. In real-life scenarios you can put a different node for your timesheet system or an HTTP Request node to retrieve the data if the custom node is not yet available.
- ItemList node (SortElements) sorts the records by User, Task and due date.
- ItemList node (GetImg) gets unique URLs of the user avatars (since we are building an HTML report, I thought it would be an interesting exercise to learn how to insert images into the report).
- HTTP Request node downloads these images, after this list is created. The results will be available in the binary section of the node.
- Merge node with Outer Join and Merge by Index mode combines our original timesheet table with the binary data for easier processing.
- Second Function node contains a JavaScript code that creates a long character variable in a markdown format (more on that below).
- Markdown node with the Markdown to HTML mode converts the character string into a standalone HTML page.
- Move Binary Data node converts the HTML page into a binary object, so that you can directly download the report from an n8n UI or attach it to an email.
Prerequisites for building the workflow
- n8n in Docker: n8n is a fair-code licensed automation tool. What I personally like about this tool as a programmer is its flexibility. In this tutorial we will write a JavaScript code to create a custom timesheet report.
- Some JavaScript knowledge. Please note that this article contains a bit of JavaScript code, so it would be helpful to understand what the provided code snippets do if you want to tweak the code.
- Basic HTML/CSS knowledge. If you are not familiar with this, all snippets with comments will be provided during this tutorial.
Building the workflow for generating markdown HTML reports
This workflow consists of three main parts that accomplish the following tasks:
- Getting and processing raw data, which is a ready-made timesheet records table
- Creating a markdown file out of the records table using the Function node
- Converting the markdown file to an HTML report using the Markdown node
In the following sections, I’ll walk you through the setup process of the nodes in this workflow. Let’s get started!
Getting and processing raw data
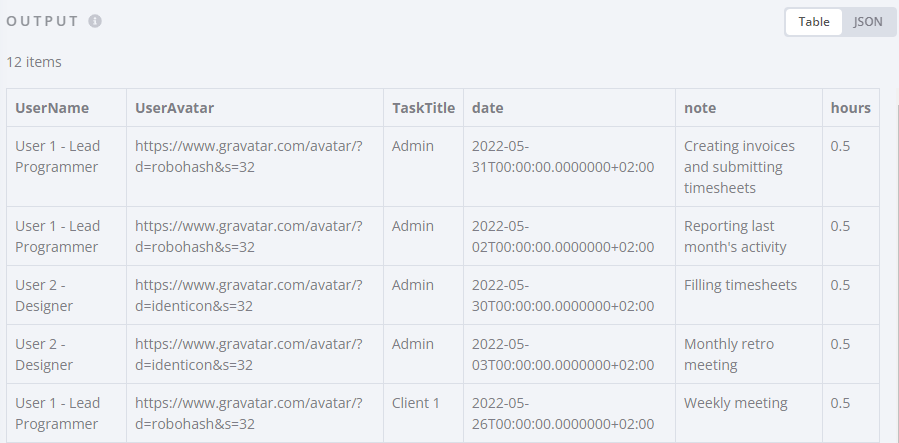
You can obtain raw timesheet data from different SAAS tools. For this workflow I used the Function node to create a table, which contains user information (Name, Avatar URL) and task details (Title, due date, note and hours spent). When you execute the Function node, the table looks like this:
Creating a markdown file
Before we start creating a markdown document, let’s recap what it is.
In n8n, you can use the Markdown node, which uses the Showdown library, to process markdown files.
Now we are ready to create a markdown document from scratch. In our case the markdown is just a long string variable. I have prepared a code example in a Function node:
// create report header and custom table style
var md_reporthead="#Timesheet report\n";
var md_style = (`
<style> table {border: 0.5px solid; border-spacing: 0px;}
table th {border-bottom: 0.5px solid;}
table thead {background: #D0E4F5;}
table tr:nth-child(even) { background: #D8D8D8;}
</style>\n\n`);
var md_reportbody=md_style+md_reporthead;
//declare several variables that are used for report generation
var tablehead = "| Date | Hours | Task Description |\n|:---|:---:|---|\n";
var cur_user="";
var cur_usernum=0;
var cur_task="";
var cur_tasktotal=0;
for (item of items) {
// Check if new user
if (item.json.UserName != cur_user) {
// Close previous user's task
md_reportbody += (cur_tasktotal) ? `\n*${cur_tasktotal.toFixed(2)} - Total hours for this task*\n` : "";
cur_tasktotal = 0; cur_task="";
// add new user and embed avatar as base64 image
cur_user = item.json.UserName;
md_reportbody += `\n## ${cur_user}\n`;
cur_usernum += 1;
} // Check for new user - ENDIF
// Check if new task
if (item.json.TaskTitle != cur_task) {
// if not empty task - add total amount of hours for *previous* task
md_reportbody += (cur_tasktotal) ? `\n*${cur_tasktotal.toFixed(2)} - Total hours for this task*\n` : "";
// Add new task header and reset total hours counter
cur_task = item.json.TaskTitle;
md_reportbody += `\n###${cur_task}\n${tablehead}`;
cur_tasktotal = 0;
} // Check for new task - ENDIF
// Add current task + update total hours
md_reportbody += `| ${item.json.date.split('T',1)} | ${item.json.hours.toFixed(2)} | ${item.json.note} |\n`;
cur_tasktotal += item.json.hours;
}
// Let's not forget the last task's total hours:
md_reportbody += (cur_tasktotal) ? `\n*${cur_tasktotal.toFixed(2)} - Total hours for this task*\n` : "";
// Finalise the report
md_reportbody += `\n*Timesheet report generated on: ${$now.toISODate()}*`;
return [{mdreport: md_reportbody}];
Here is a visual explanation of what’s going on in the JavaScript code:
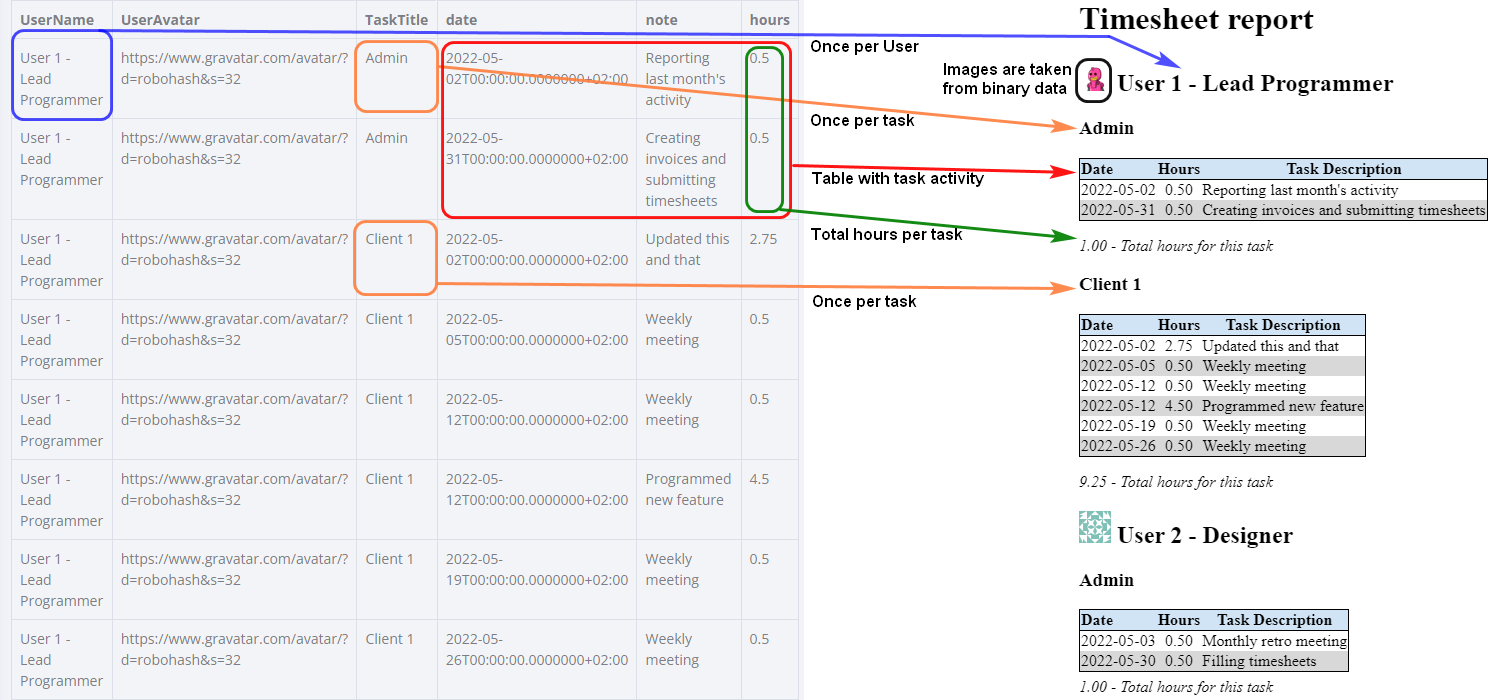
- We create a report head and add a custom HTML style. This style makes tables look nice: it adds table borders, blue header, and applies different background colors to the table lines.
- We declare a few variables which are needed during report generation: user name, task name, total hours per task.
- In the main for loop we iterate over each task in a table and populate the report according to the schematic image shown above.
There are several important things to notice.
First, take a look at these two lines:
var tablehead = "| Date | Hours | Task Description |\n|:---|:---:|---|\n";
creates a table head according to the GFM (GitHub Flavored Markdown Spec). Tables aren't part of the core Markdown spec, but they are supported in the GFM, and the Showdown markdown parser knows about them.
Second, let’s take a look how user avatars are added:
md_reportbody += `\n## ${cur_user}\n`;
Here they are embedded into the markdown document directly as a base64 string. Of course, it is always possible to provide a direct link to an image. However, direct links don’t always work, especially if you want to put an image from your CRM system or a cloud storage which access could be restricted.
Another option is to provide a relative link, but this requires you to send several files along with the HTML report, which is not convenient. That’s why embedding images seems to be an optimal solution here.
Generating an HTML report
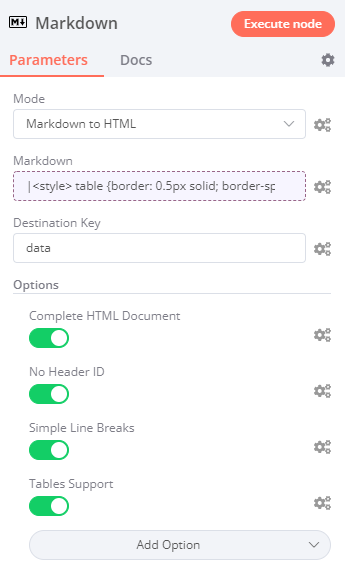
Once you have prepared a markdown document, it is possible to convert it via the Markdown node. To do this, configure the following parameters in the Markdown node:
- Mode: Markdown to HTML.
- Markdown: `{{$json["mdreport"]}}`.
This is an expression which contains the text variable from the Function node. - Complete HTML Document: toggle to true
This option returns a full HTML page. - No Header ID: toggle to true
The header ID is provided, as we don’t use them in this example. - Simple Line Breaks: toggle to true,
so that only one new line symbol is sufficient to separate the lines. - Table Support: toggle to true
This option will display the tables in our report.
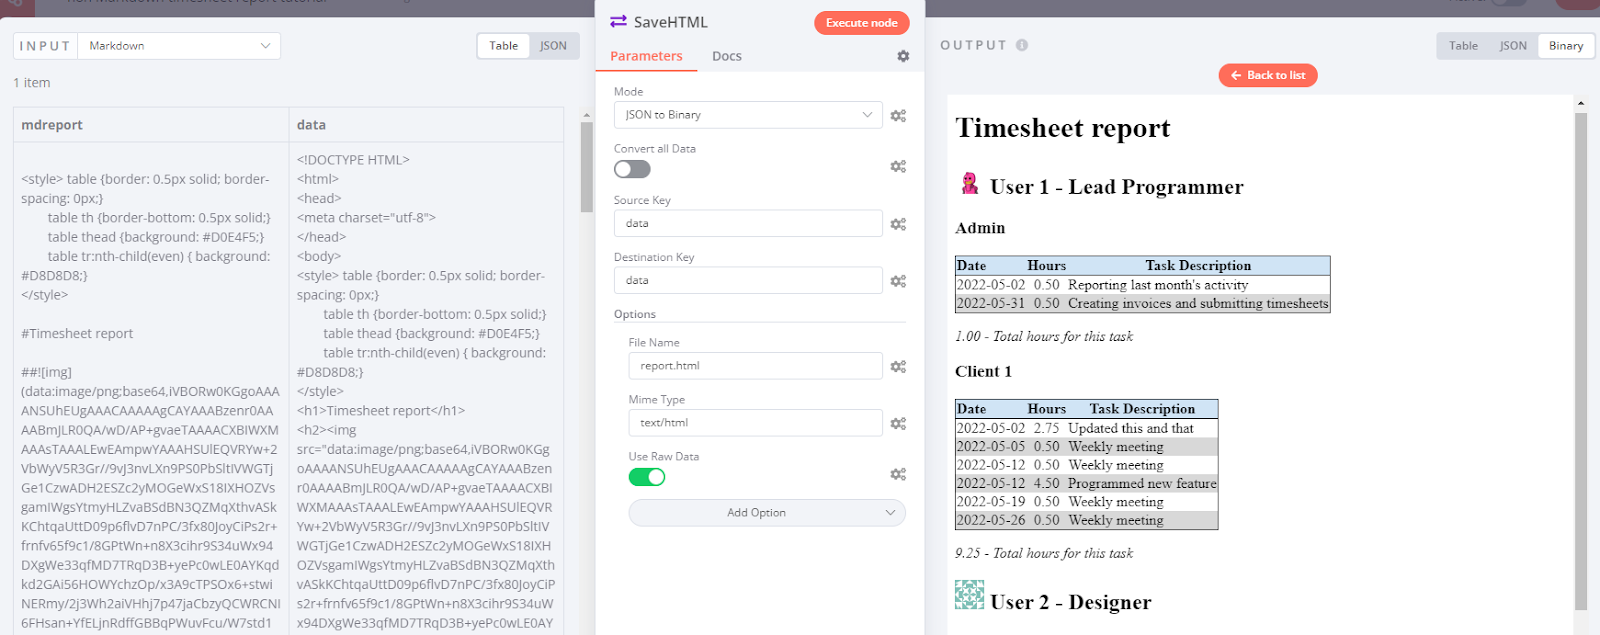
After the markdown document is converted to HTML report, you need to use the Move Binary Data node with the following options:
- Use Raw Data: toggle to true
This option saves the HTML report without any further transformations. - Mime Type: text/html
This option can be set for convenience, so that the final output can be viewed directly in the workflow canvas.
When you execute the Move Binary Data node, the result looks like this:
Once the report is ready, you can send it via an email as an attachment or upload it into a cloud storage.
Important note! If you want to send the report directly in the email body, then the Markdown node option Complete HTML Document should be switched off. It can also happen that an email service will alter the HTML code for better security. This can lead to some unwanted results, such as loss of table styling or images becoming unavailable.
What’s next?
In this tutorial sample data was provided. You can try to connect your favorite CRM or Timesheet system with n8n and update the Function node to create a similar report with your own data.
If you want to test your JavaScript skills, feel free to update the code and calculate the total amount of hours per user, for example.
If you want to dive deeper into n8n, you can:
- Try out other n8n setups: download the free desktop app, sign up for n8n.cloud or self-host n8n.
- Read more tutorials and check out the workflows page to get inspiration for your next projects.
- Contribute to the code, as n8n is source-available. But there are other ways you can contribute as well, depending on your skills.