You've built your AI agent, added reliability controls, tested with evaluations, and deployed to production without errors. The last piece is knowing how to monitor usage and performance of your AI steps on an ongoing basis.
Execution metrics may look healthy but how do you know what the agent is saying to users? Which decisions is it making when nobody's reviewing the output? What does it remember about each session, and should it?
These are behavioral questions — and most monitoring setups don't answer them.
This article covers both layers: the operational infrastructure that keeps your agent running, and the behavioral visibility that tells you what it's actually doing — how to log and structure agent outputs, how to expose memory state for compliance and transparency, and how to build dashboards that give stakeholders insight without requiring platform access.
What uptime dashboards don't tell you about your agent
Uptime dashboards answer a narrow question: is the system running? For traditional services, that's often enough but for AI agents, it covers maybe half the picture.
In practice, dashboards let you understand if the agent is running, how often it fails, how long executions take, and what the queue depth is. These are the same signals you'd track for any production service, extended with agent-specific dimensions like token consumption and LLM provider response time. If your agent goes down or slows to a crawl, operational monitoring catches it.
What it doesn’t catch is if the agent is confidently giving users wrong answers, even if the speed of the response is high. Or if it's retaining session data it shouldn't or calling the same tool regardless of context. These are behavioral questions which require a different kind of visibility that extends beyond the operational analysis: visibility into what the agent decided, why it decided it, and whether that decision was consistent with how it behaved yesterday.
The sections below cover how to build both layers: the behavioral visibility most teams are missing, and the operational infrastructure that keeps the whole system observable.
Building behavioral visibility into your agent workflows
The Cloud Security Alliance's survey of 285+ security professionals found that only 21% of organizations actually know what AI agents are running in their environment at any given moment. With the lack of systematic visibility, teams naturally must compensate with a human oversight to see what their agents are doing.
For most teams, that question is uncomfortably hard to answer. This is exactly the gap behavioral monitoring is meant to close.
What to capture and why
Behavioral monitoring starts with deciding what to log. Not every agent needs every signal, but these are the categories that give the most actionable insights:
- Agent responses — what the agent said to the user, verbatim;
- Decision reasoning — which tools it considered, which it selected, and what drove the choice;
- Confidence indicators — how certain the agent was, if your model or framework provides this signal;
- Tool usage — which tools were called, with what parameters, and what they returned;
- Guardrail triggers — what got flagged, what got sanitized, what passed through;
- Memory state — what the agent "knew" about the user or session at the time of the response.
The EU AI Act (Article 12) requires high-risk AI systems to log activity automatically throughout their lifetime. Your agent may not fall into that category — but the first time someone asks 'why did the agent say that to a customer?', you'll wish you had the logs.
Designing an output logging schema
Unstructured logs are better than no logs at all. And structured logs are what you can actually query. The difference is whether you can query your agent's behavior or just scroll through it.
A practical schema for agent output logging:
| Field | Example |
|---|---|
| execution_id | abc123 |
| timestamp | 2025-01-15 10:30 |
| user_id | user_456 |
| agent_response | "Your refund has been processed..." |
| action_taken | process_refund |
| confidence | 0.92 |
| tools_used | [lookup_order, process_refund] |
| flagged | false |
Store this in a queryable destination — a database, a data table, or an external analytics tool. The execution_id field is critical: it lets you jump from a suspicious output directly to the full execution trace when you need to investigate. The confidence field depends on whether your LLM returns it.
Agent memory visibility
Memory is the least monitored and most consequential part of agent behavior. What the agent keeps across sessions shapes every future response, and without logging memory state, it’s hard to trace why.
Here’s why tracking memory matters:
- Debugging: An agent responds oddly to a returning user. Without seeing what the agent "remembers" from previous sessions, you're guessing at the cause. With memory snapshots logged alongside outputs, you can see exactly what context led to the response.
- Compliance: Regulations require to demonstrate what data AI systems retain about individuals. If your agent stores user preferences, conversation history, or personal data in memory, you need to be able to surface that on demand.
- User trust: Showing users what the agent knows about them — and letting them correct or delete it — is becoming a baseline expectation.
Store memory snapshots alongside agent outputs, or query the memory store directly if using an external database for persistence. Either way, memory should be inspectable.
The operational layer: tracking AI step performance at scale
Behavioral monitoring tells you what the agent is doing, while operational monitoring shows whether it can keep doing it and at what cost.
The specific signals to track are covered in detail in our guide on AI agent metrics: what to track and why. This section focuses on the infrastructure that captures them.
For traditional services, infrastructure monitoring is a solved problem: CPU, memory, uptime, error rates. Agent workloads add dimensions that standard dashboards weren't designed for. Agents maintain stateful context that doesn’t survive a naive restart, run long operations that confuse standard liveness checks, and consume resources unpredictably based on reasoning complexity.
This means your monitoring infrastructure needs to answer questions like: is the latency spike coming from your system or the LLM provider? Is queue depth climbing because you need more workers or because executions are taking longer? Is a failure rate increase caused by a code change or an external API degradation?
When something degrades, it may be useful to separate signals: your infrastructure health from your LLM provider's health from your agent's behavioral quality. This way, you know which layer to investigate without losing time on figuring out where to look.
How to monitor AI step usage and performance in n8n
n8n lets you implement both monitoring layers within the same platform where your agents already run. Behavioral data gets captured in the workflow itself, core operational metrics are available out of the box, and integrations with external platforms are possible when you need to go deeper.
In n8n, both layers share the same execution history, so when a behavioral signal needs investigation, the operational context is already attached to the same execution trace. Here's what that looks like in practice.
Operational monitoring
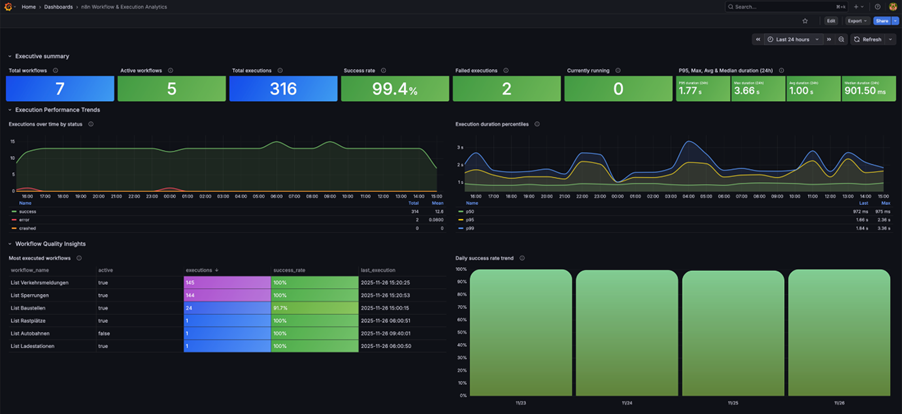
The Insights dashboard gives you immediate visibility without configuration into production execution counts, failure rates, and runtime per workflow, with manual tests and sub-workflow runs filtered out automatically.
When a single instance isn't enough, self-hosted deployments provide a Prometheus-compatible /metrics endpoint that feeds directly into your existing Grafana or Datadog stack without the need for custom exporters.
Health check endpoints (/healthz and /healthz/readiness) plug into any uptime service so you know within seconds if an instance becomes unreachable. For teams managing multiple workflows or instances, Enterprise log streaming sends execution events to centralized logging which gives you one view across your entire agent infrastructure.
Behavioral monitoring
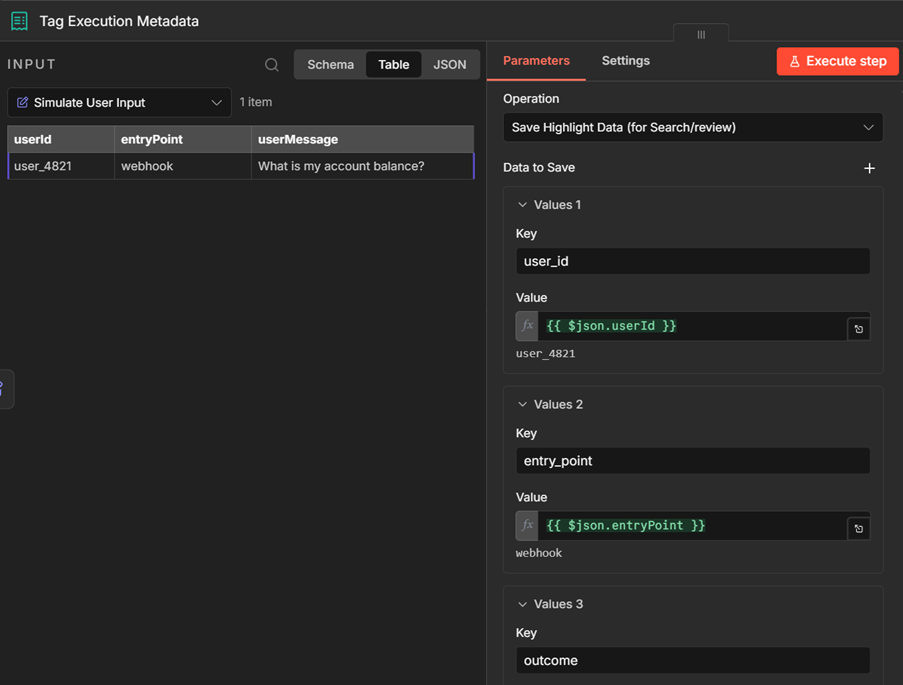
The output logging schema described earlier translates directly into n8n workflow steps. The Execution Data node tags each execution with custom metadata, such as user IDs, outcomes, entry points. This makes it possible to query patterns over time and see which user types trigger the most guardrail violations, and which entry points produce the highest escalation rates.
Agent responses, tool usage, and guardrail triggers get written to Data Tables or an external database as additional nodes in the same workflow. Your agent runs and the logging is tracked in one execution rather than two separate systems.
Memory sub-node state can be captured alongside outputs, giving you the full picture of what the agent knew when it made a decision.
For token-level tracing, self-hosted instances integrate with LangSmith (covered in detail in How to debug AI agent failures).
The result is a monitoring setup that grows with you: start with Insights and execution tagging, add structured output logging when you need behavioral visibility, extend to LangSmith when token-level economics matter. Each layer adds depth without requiring you to reinvent what's already running.
Wrap up
Monitoring gives you ongoing visibility into your agent behavior – not just whether executions complete, but what the agent is doing and when it changes its patterns.
In this article we covered:
- The difference between operational and behavioral monitoring; and why many teams only build the first;
- What behavioral signals to capture: agent responses, tool usage, confidence, guardrail triggers, and memory state;
- How to structure output logs so you can inspect agent behavior;
- Why memory visibility matters for debugging, compliance, and user trust;
- How to implement both layers in n8n gradually — from native Insights to structured logging and external tracing.
The agents you run now will behave differently over time as they process new data, users, and edge cases. With monitoring you can tell whether that change is acceptable or it's time to intervene. Start with what's built in to match your deployment size and grow as you go: don't over-engineer before you know what questions you'll need to answer.
What’s next
Monitoring is the final layer in the AI agent deployment which feeds back into every earlier stage. A behavioral trend you notice here might point to a missing test case in your evaluations. A recurring guardrail trigger might mean your prompt needs tightening. What you learn from monitoring shapes how you build, test, and improve your agents over time.
We’ve written the following guides to help you understand better each stage:
- How can I make AI Agents more reliable and restrict the actions they can take?;
- How to Debug Failures or Missteps in AI Agent Behavior?;
- How to evaluate the performance of AI agents — systematic testing with test datasets and quality scoring
- AI agent metrics: what to track and why — choosing the right metrics for your use case and stage
Try n8n yourself
- Explore the advanced AI documentation for tutorials, examples, and LangChain concepts
- Browse AI workflow templates on the n8n template gallery
- Get started with n8n to turn agent outputs into data you can query, trend, and act on.