Debugging is part of every stage of an AI agent's life: you reach for it while building the first version, every time you update a prompt or swap a tool, and most critically, in production when something quietly goes wrong.
When you debug non-AI workflows, the process looks straightforward: if a step fails, you can quickly see the error and fix it. AI agents operate differently: they may hallucinate, pick the wrong tool, or even ignore your instructions altogether, while on the surface the execution is successful.
To debug failures or missteps in AI agent behavior, you need to see what the agent did, what it decided, and why. This article covers three levels of debugging:
- filtering executions to find the problematic ones,
- tracing the agent's decision chain step by step,
- and using external platforms for in-depth analysis.
Let’s dive in!
Where do agent failures typically come from?
When an agent misbehaves, the first instinct is to question the model. But in practice, the model’s context and surrounding tooling matter much more than the model itself. Below we’ve outlined a few categories for common AI agents failures that happen in production.
| Issue | What to Check |
|---|---|
| Agent hallucinated information | Was the necessary data in the prompt context? |
| Agent called the wrong tool | Are tool descriptions clear and distinct? Check for overlap or ambiguity. |
| Agent called the right tool with wrong parameters | Are parameter descriptions specific enough? |
| Agent looped or repeated itself | Does the agent have proper stop conditions? Check full message history. |
| Output format was wrong | Was schema validation applied? Check validation results. |
| The language model was selected incorrectly | Was the model optimized for tool use? Is it large enough for the given task? Try the most potent LLMs first and once the Agent works, scale down for cost optimization. |
Start with the inputs first and see if the agent had the right data. If it didn’t, simply tuning the prompt won’t solve the issue. If the necessary data was there but the agent still chose wrong steps, make sure the tool descriptions and parameter definitions follow the best practices before changing the model itself.
How deep do I need to go when debugging AI Agents?
Arize's research puts it well: in agentic systems, traces are the source of truth for what the system actually does, as opposed to what the code says it should do. Every operation traditionally performed on code must now be performed on traces.
From the LangChain's 2026 State of AI Agents report, we know that 89% of organizations have some form of observability for their agents, and 62% have detailed tracing to inspect agent steps and tool calls. The tooling exists, so the main question comes down to the level of depth your situation requires.
The first and second debugging levels live in your agent development platform or in the external tracing software. While the details may vary between platforms, the general approach is the same.
Level 1: Tag and filter executions
Before you can debug a failure, you need to find it. In production, an agent might run hundreds or thousands of times per day. It’s impractical to scroll through a flat list of executions to find the one that went wrong.
The solution is to use structured metadata. Tag each execution with searchable fields, such as the user or session ID, the entry point that triggered it and the outcome. When something breaks, you can still find executions for user X in the given number of hours.
A practical tagging setup for an agent workflow might include: the trigger type (webhook, schedule, chat), the user or session identifier, the model used for that execution, and the agent's final outcome. These fields alone already let you slice your execution history by several dimensions.
This sounds obvious, but it's the step that’s easy to skip. Without it, you might lose valuable time searching every debugging session before starting the actual analysis.
Level 2: Trace the decision chain
Once you've found the problematic execution, you need to reconstruct what the agent did and why. This means inspecting every step: what data went into the agent's context, which tools it decided to call, what parameters it passed, what each tool returned, and how the agent interpreted those results.
The key things to look for at this level:
- Did the agent receive the correct context in its system and user prompts?
- Which tools did the agent call, and in what order?
- What did each tool return — and was that data actually useful?
- At what point did the agent's reasoning diverge from what you expected?
Most debugging sessions end here. You find that the agent didn't have a critical piece of data in its prompt, or a tool returned an unexpected format, or two tool descriptions were ambiguous so that the agent picked the wrong one.
It may still happen that the trace looks correct but the output is still wrong. Before escalating further, try reproducing the failure with the exact same inputs. If the output varies across reruns, you're likely dealing with model non-determinism, and this can be fixed by updating model parameters. If the agent fails the same way consistently, the problem could stem from the model itself.
Level 3: Try tweaking LLM parameters or testing various models
If the trace looks fine and the agent still misbehaves, the next lever is the model itself - either how it's configured or which one you're using.
Start with parameters. Temperature is the most common culprit: a high value introduces variability that helps with creative tasks but hurts agents that need to follow strict instructions or call tools predictably. Lowering it (or setting it to 0 for deterministic tasks) often stabilizes outputs that vary across reruns. Other parameters worth checking are top_p, max tokens (truncated responses can look like reasoning failures), and any provider-specific options like reasoning effort or tool-choice modes.
If parameter tuning doesn't help and the agent fails consistently in the same way, the issue may be the model's capability. Teams often end up on the wrong model for a couple of reasons: they picked a cheap or fast one early on to control cost, or they stuck with whatever was the default when the agent was built. Either way, it's hard to tell whether a failure comes from the model's capability ceiling or from something else in your setup.
A useful approach is to go from the top. Run the problematic input through the strongest available model (Claude Opus, GPT-5.x, Gemini Pro). If it still fails, the issue isn't model capability, go back to your prompt, tools, or context. If it succeeds, you've confirmed the task is solvable, and you can step down to cheaper or faster models until you find the most cost-effective one that still handles agent’s tasks reliably.
This is also the level where external tracing platforms like LangSmith, LangFuse, or Arize Phoenix become useful - not as a separate debugging step, but as a way to compare runs across models and parameter settings, with full prompt and token visibility, latency, and cost per call.
Debugging vs. evaluation: when to switch?
Debugging is reactive which means that you investigate when something goes wrong. But if you find yourself debugging the same failure patterns repeatedly, the problem lies in the missing evaluation layer rather than your debugging process.
Evaluations test your agent systematically before users encounter failures. Debugging reconstructs one broken execution, and evaluation runs dozens or hundreds of test cases across your agent to catch regressions, compare prompt versions, and score output quality over time.
The two processes feed each other. Debugging helps identify a new failure mode which you can then add as a test case in your evaluation suite. Evaluation catches a regression and you can debug the specific execution to understand why.
How to debug AI agents in n8n?
n8n is an AI workflow automation platform that lets you build AI agents visually. Connect LLM nodes, tools, and logic steps on a canvas. Every execution gets recorded with full input/output data at each node, so we can demonstrate how the debugging principles above translate into real workflows.
The three levels described above map directly to n8n's capabilities: from execution-level metadata, step-by-step trace inspection and model-level configs to external platform integration.
Tagging and filtering executions
The Execution Data node attaches searchable metadata to any execution: user IDs, entry points, outcomes, session identifiers. When something breaks, you can filter by the relevant field in the executions list instead of scrolling through hundreds of runs. You can also add several tags to a single workflow.

Tracing the decision chain
Every workflow execution in n8n records complete input and output data for each node. For AI Agent nodes specifically, you can inspect the full prompt the agent received, which tools it called and in what order, what parameters it passed to each tool, what each tool returned, and how the agent used those results to formulate its response.
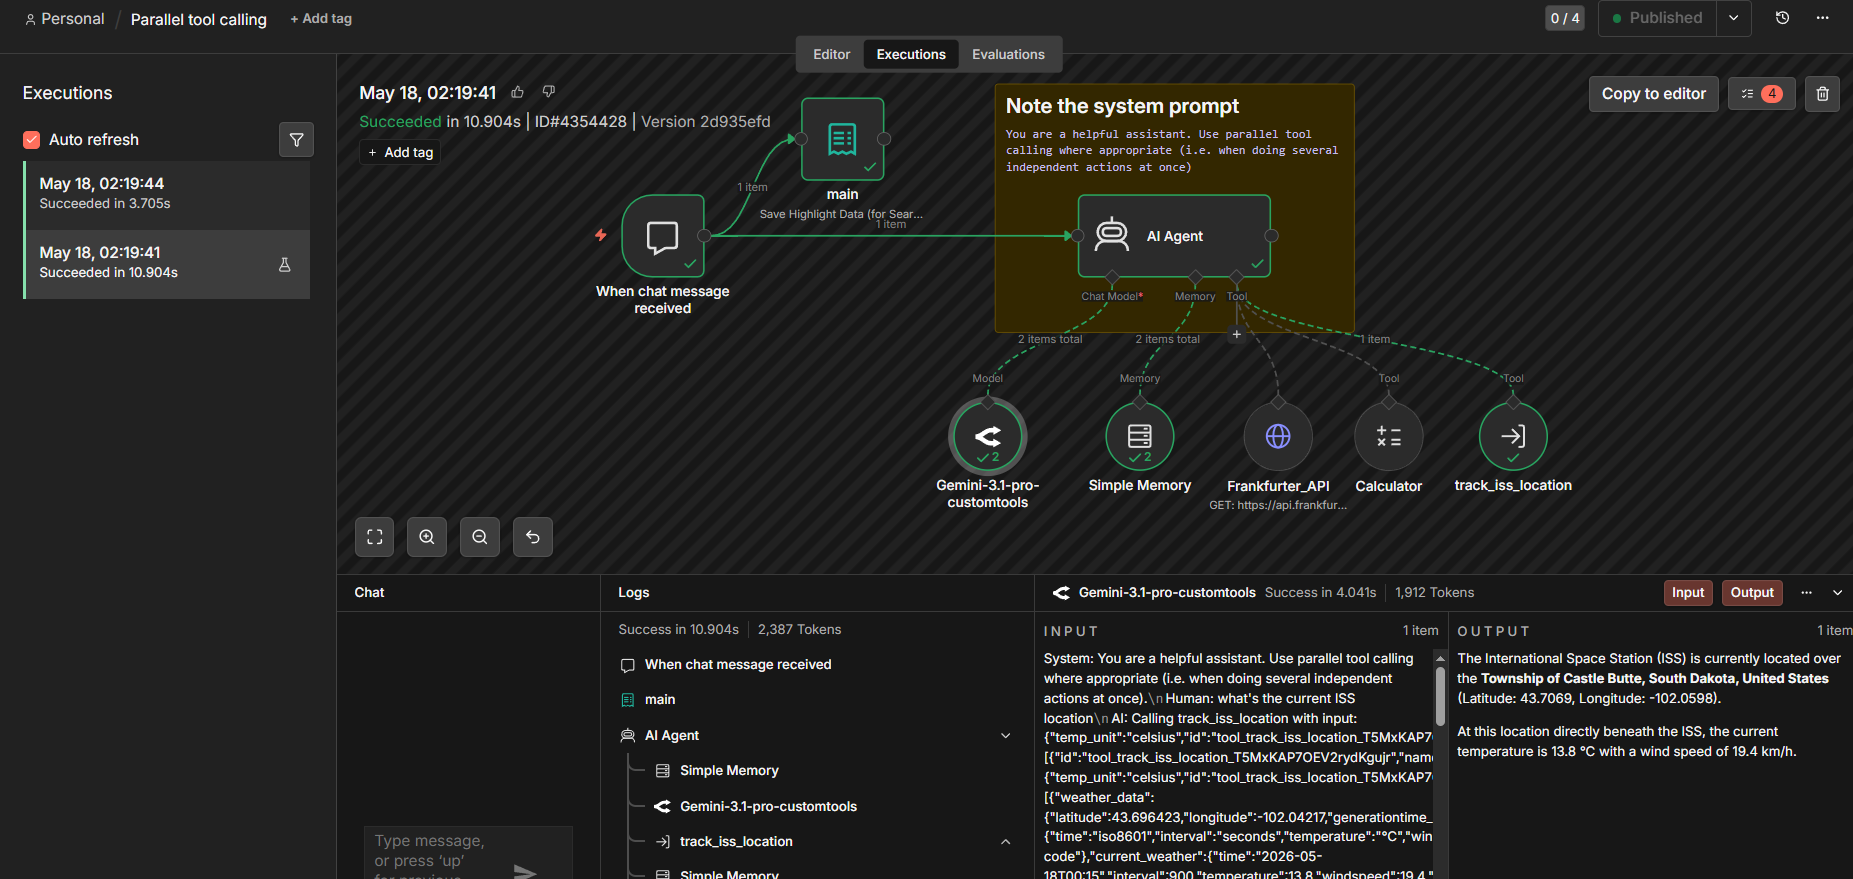
For example, if a customer support agent hallucinated a refund policy, the trace would show: the system and the user prompts, the tool call with parameters and a response, and the final output. Each layer narrows the root cause from 'the answer was wrong' to a specific, fixable gap.
The logs panel provides a timeline view of key events in sequence, helping you spot where things diverged without clicking through every node individually.
When you find the problem, n8n lets you replay the execution: copy it to the editor, pin the trigger data, make your correction, and re-run with the same inputs. You don’t need to recreate the conditions manually or wait for the issue to occur again in production.
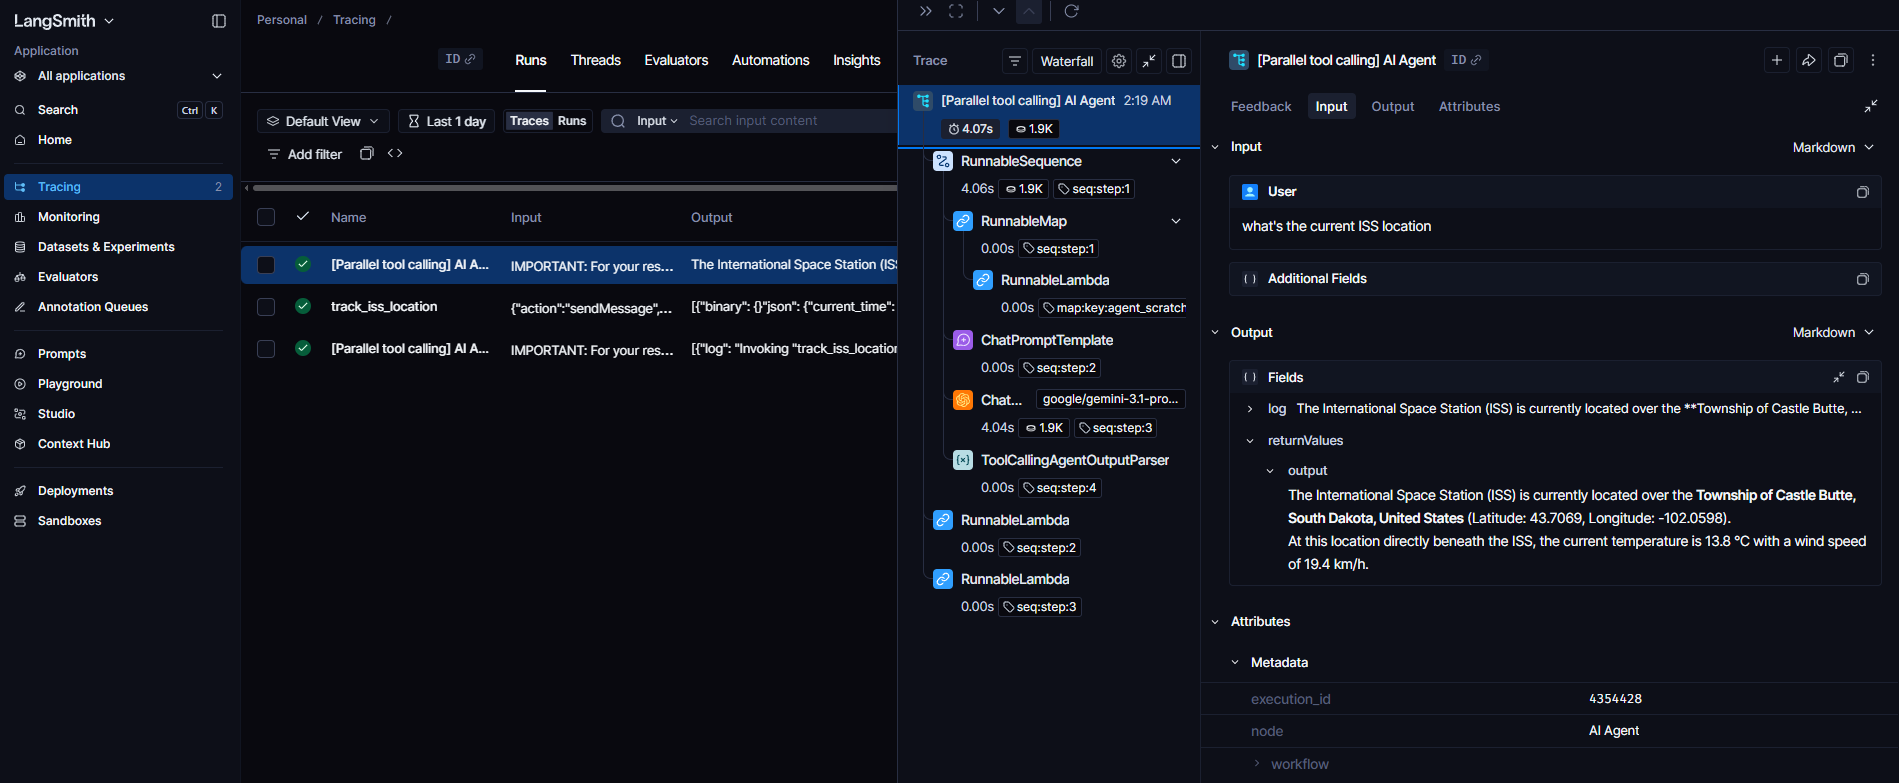
External tracing with LangSmith. Self-hosted n8n instances can forward AI Agent traces to LangSmith by setting a few environment variables — all AI Agent nodes then send trace data automatically, with no per-node configuration. You get the extended data on traces in a UI specialized for agent runs.
Tuning model parameters and swapping models. In n8n, AI Agent nodes don't hold model configuration directly — the model is attached as a swappable sub-node (OpenAI Chat Model, Anthropic Chat Model, Google Gemini Chat Model, and so on). Each sub-node exposes its provider's parameters. To test a different model, connect to a different sub-node without touching the agent's prompt or tools, then re-run the pinned execution to compare behavior on the same input.
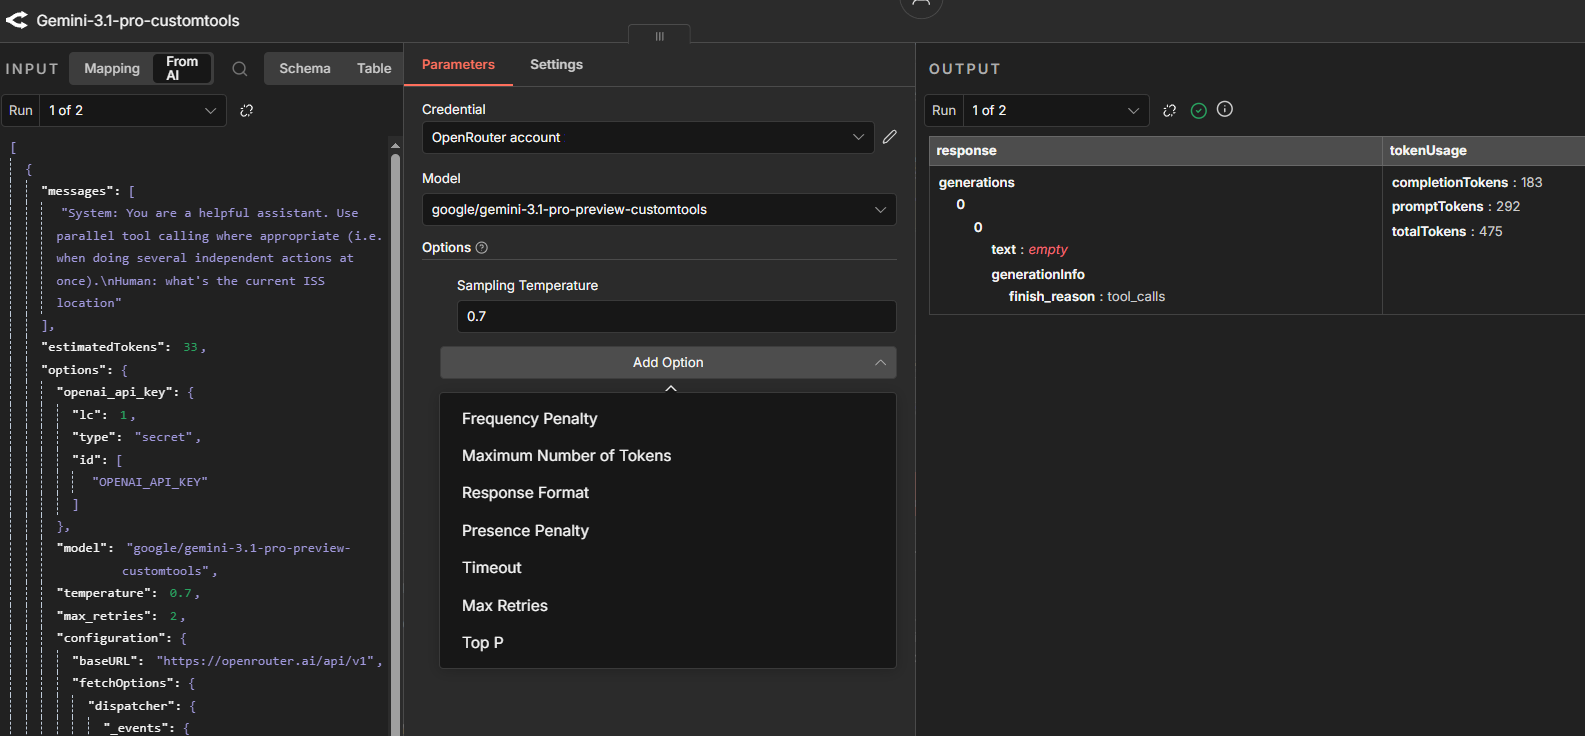
For logic that goes beyond what the AI Agent node exposes, the LangChain Code node lets you write custom code for both AI Agent root nodes, as well as sub-nodes directly in the workflow, while keeping execution data visible in the same trace view.
Wrap up
Every AI Agent debugging session should end with two outcomes: the fix itself, and a test case that ensures the same failure never reaches production again. That's where debugging helps to build reliability and not simply react to outcome.
In this article, we covered:
- Where agent failures actually come from: most trace back to context (missing data, ambiguous tool descriptions, underspecified parameters), rather than model capability;
- Three levels of debugging depth: tagging executions to find them fast, tracing the decision chain step by step, and tuning model parameters or swapping models when the trace looks fine but the output is still wrong;
- When to move from debugging to evaluation: if the same failure patterns keep recurring, the problem is a missing test suite, and not a debugging gap;
- How to debug AI Agents in n8n at each level: the Execution Data node for tagging, built-in execution history and logs for tracing, LangSmith for a specialized agent-run UI, and model sub-nodes for parameter and model changes.
In the end, you want to make failures diagnosable rather than trying to eliminate every wrong case.
What's next
Debugging, evaluation, and production deployment are interconnected, with each stage informing the other. Follow the resources below to cover each stage in more depth:
- How can I make AI Agents more reliable and restrict the actions they can take?;
- Building your own LLM evaluation framework — hands-on tutorial for implementing LLM-as-a-judge, goes deeper than the evals overview article;
- 15 best practices for deploying AI agents in production — covers infrastructure, scaling, and monitoring beyond debugging.
Every debugging technique in this article is built into n8n.
Start your journey with n8n Cloud for free to get full execution visibility from your first agent workflow!