When building AI agents, you are most likely going to set up evaluation tests at some point. You’ll need to decide what to actually measure.
The temptation is to track everything – success rates, latency, token counts, quality scores, costs. But tracking metrics you never act on just adds maintenance work without improving the quality. Every dashboard you build costs attention to maintain.
The practical approach is to track only those metrics that influence decisions. If a number won't change how you build or deploy your agent, you probably don't need it.
This article breaks down four categories of agent metrics:
- Execution metrics – is the agent running, and how long does it take?
- Quality metrics – is the output correct and useful?
- Efficiency metrics – what's the resource cost?
- Safety metrics – is the agent staying within bounds?
Not every metric applies to every agent. A simple classifier needs different tracking than a customer-facing chatbot.
What metrics should I track for AI agent performance?
In 2025, only 15% of teams achieved comprehensive evaluation coverage — despite 72% believing thorough testing drives reliability (Galileo, State of Eval Engineering Report). The gap is operational: teams know what to measure but lack the practices to do it consistently.
LangChain's 2026 State of Agent Engineering survey of 1,300+ professionals confirms this: output quality is the top production barrier, cited by 32% of respondents — ahead of cost, latency, or infrastructure. Yet most teams track observability metrics and only 52% adopt quality measurement to see if the agent performed good enough.
The metrics below are grouped by what they measure. Select the ones relevant to your use case and set up tracking for those only.
Execution metrics: is the agent running, and how fast?
Execution metrics are the baseline — they tell you whether the agent is functioning before you assess whether it's functioning well.
Task success rate
What percentage of executions complete without errors?
It's your health check but it needs careful interpretation. HCAST benchmark research shows that agents succeed 70-80% on tasks under one hour but drop below 20% on tasks over four hours— success depends heavily on task complexity.
And even on tasks an agent can solve, reliability across repeated runs can drop significantly: a study of 60,000 agent trajectories by the KTH Royal Institute found gaps up to 24.9 percentage points between best-case and worst-case performance on the same tasks.
Track success rate across repeated runs and be mindful of task complexity: a single simple pass may tell you very little. A sudden spike in failures usually points to an external API going down or a recent change breaking something. When the amount of failures gradually increases, it signals an accumulation of edge cases that the agent can't handle.
Run time and latency
How long does execution take from trigger to completion?
For agents, average latency can be misleading. Track p95 latency (the slowest 5% of requests) alongside the average. If the gap is large, you have outlier cases worth investigating — often caused by growing prompt sizes, unnecessary tool calls, or slow external APIs.
Tool call count
How many tools does the agent invoke per task?
More isn't necessarily bad, but unexpected increases are a diagnostic signal. If a task that normally requires two tool calls suddenly needs eight, the agent is likely stuck in a retry loop or confused by ambiguous tool descriptions. Track the count over time — a gradual upward trend across executions often reveals that the agent is struggling to select the right tool as tasks get more complex. It’s worth investigating before it shows up in latency or cost.
Quality metrics: is the output correct and useful?
These measure whether the agent's output is correct and useful.
Accuracy and correctness
Does the agent provide the correct answer? This is the core quality metric for most agents, but how you measure it depends on your output type.
For categorical outputs (classification, routing decisions), exact match works — the answer is right or wrong. For open-ended outputs (summaries, research, customer responses), you need LLM-as-a-judge evaluation — a separate model scoring the output against defined criteria.
The distinction matters because execution metrics can mask quality failures: an agent can achieve high tool-call accuracy but still generate outputs a domain expert would reject. Measuring accuracy means evaluating the final output, beyond the steps that produced it.
For production monitoring, log agent outputs along with expected outcomes when known, then run periodic evaluations on a small portion of the real data.
Hallucination rate
How often does the agent invent information not present in its context?
What matters most isn't the absolute hallucination rate but the cost of a wrong answer in your specific use case. A low rate may work for creative writing but be unacceptable for medical recommendations. Measure it by comparing agent outputs against the context that the agent received — if claims appear that aren't grounded in the provided data, those are hallucinations.
What to watch for: Hallucination rates often increase when the context is insufficient, the model temperature is too high, or prompts are vague. If users report "the agent made something up," add these cases to your evaluation dataset.
Schema compliance
Does the agent return outputs in the expected format?
When agent output feeds downstream systems, a missing field or unexpected data type can break the pipeline unnoticed. Track how often outputs fail validation: high schema violation rates usually mean your schema is too strict, the model temperature is too high, or your prompt doesn't clearly describe the expected format.
Efficiency metrics: what does each execution cost?
Efficiency metrics measure resource consumption and cost. They connect agent performance to business viability. An agent that produces perfect outputs but costs $10 per task may not be sustainable at scale — and costs can escalate quickly without direct visibility into its performance.
Token usage
How many input and output tokens does each execution consume?
For most LLM providers, tokens directly translate to costs.
Token usage spikes often come from growing conversation history, detailed system prompts, or agents requesting unnecessary context. Track input and output tokens separately — understanding where tokens are consumed helps pinpoint whether the issue is in your prompts, context loading, or the model's responses. In general, if one workflow costs 10x more than similar ones, investigate its prompt and tool usage.
Cost per task
What are the actual costs incurred per agent execution?
The cost per task should be relatively stable. If it doubles after a prompt change, you might have added unnecessary context. Track cost alongside quality. Sometimes spending more tokens improves outcomes enough to justify the increase. The key is knowing when it does and when it doesn't.
The scale of this challenge is growing. Goldman Sachs forecasts a 24-fold increase in global token consumption by 2030, driven mainly by enterprise AI agents that operate continuously across workflows. Teams that understand their cost-per-task baseline early can make informed decisions about model selection, prompt optimization, and which agent steps justify higher spending.
Safety metrics: is the agent staying within bounds?
These measure whether the agent stays within acceptable boundaries. As agents gain more autonomy — accessing tools, making API calls, handling user data — the risk surface grows proportionally. Deloitte's 2026 AI report states that only 21% of organizations have mature governance models for their AI systems, which means most teams are deploying agents without systematic safety tracking.
Policy violations
How often do your inputs or outputs trigger guardrail rules?
Count violations by type — jailbreak attempts, PII detected, blocked content, off-topic responses — to understand what's actually hitting your boundaries. An increase in jailbreak attempts might indicate that your agent is under attack. Frequent PII violations in outputs suggest your prompt needs stronger instructions for handling data.
Restricted action attempts
How often does the agent try to use tools or take actions it shouldn't be performing?
If you're using role-based access control, log every access denial. Track which tools get denied most and for which user types — this reveals whether your permission model matches actual usage patterns.
If legitimate users frequently hit permission denials, your access model may be too restrictive. If you see attempts to access sensitive tools from unexpected sources, you should investigate.
Escalations to human review
How often does the agent route to a human instead of handling the task autonomously?
Track it as a percentage of total executions, and more importantly, track the reasons for escalation. High escalation rates aren't necessarily bad and may be appropriate for high-risk decisions.
But if the same category of question consistently escalates, the agent likely needs improvement in that area rather than more human reviewers. Track the reasons for escalation to find out what the agent is struggling with most.
How to choose the right metrics for your stage?
Not every metric matters from day one. What you track should match where you are in development and what questions you're trying to answer.
Start small. Success rate plus one quality metric – correctness or schema compliance – covers most early needs.
Add metrics when questions arise. "Why did costs spike last week?" prompts token tracking. "Why are users unhappy despite high accuracy?" prompts helpfulness scoring. Let problems drive measurement, not the other way around.
Match metrics to maturity:
| Stage | Focus on |
|---|---|
| Development | Quality metrics (correctness, schema compliance) |
| Early production | Add execution metrics (success rate, latency) |
| Scaling | Add efficiency metrics (token usage, cost per task) |
| High-risk use cases | Add safety metrics (violations, escalations) |
Track trends, not snapshots. A single data point means little. Instead, weekly averages drifting downward tell you something's degrading before it becomes a visible problem.
How to track agent metrics in n8n?
Most monitoring tools sit outside your agent.
n8n takes a different approach: because your agent already runs as a workflow, metrics tracking becomes part of the workflow itself. You can add monitoring the same way you add any other step, as nodes on the same canvas, with the same visibility into what's happening.
Each metric category from this guide connects to a specific n8n capability — some are native, some require configuration, and some extend through external integrations. Knowing which layer handles which metric helps you avoid building custom tracking for something the platform already does.
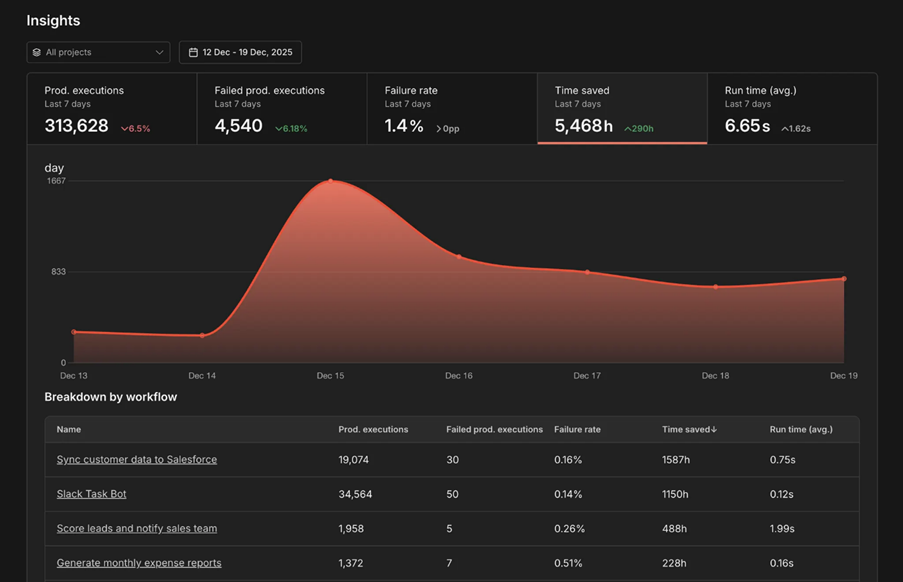
Execution metrics are covered by the Insights dashboard — it displays production execution counts, failure rates, and runtime data per workflow. Insights only tracks production executions (triggered by schedules, webhooks, or other automation), filtering out manual test runs and sub-workflow executions automatically. For more granular filtering, the Execution Data node lets you tag each execution with custom metadata — user IDs, entry points, outcomes — and query by those fields later.
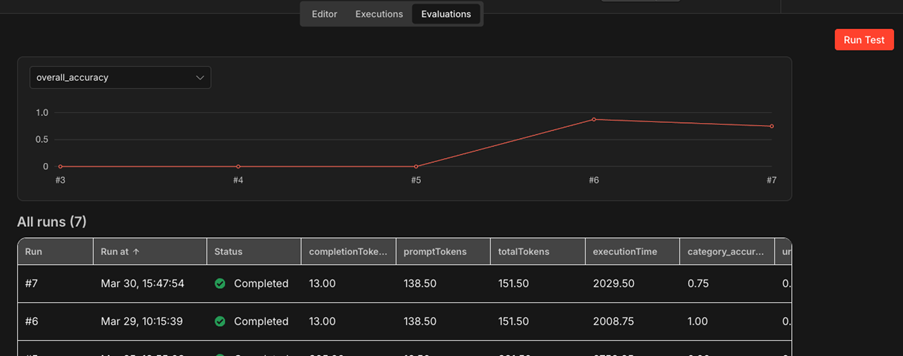
Quality metrics are handled through the Evaluations feature. Create test datasets in Data Tables, run your agent against them, and apply built-in metrics: correctness comparison, string similarity, categorization accuracy, and tools-used verification for tool-calling agents. For hallucination tracking, set up a custom LLM-as-a-judge evaluation that checks whether agent responses are grounded in the provided context. The Evaluations tab tracks aggregate scores across runs, so you can spot quality regressions over time.
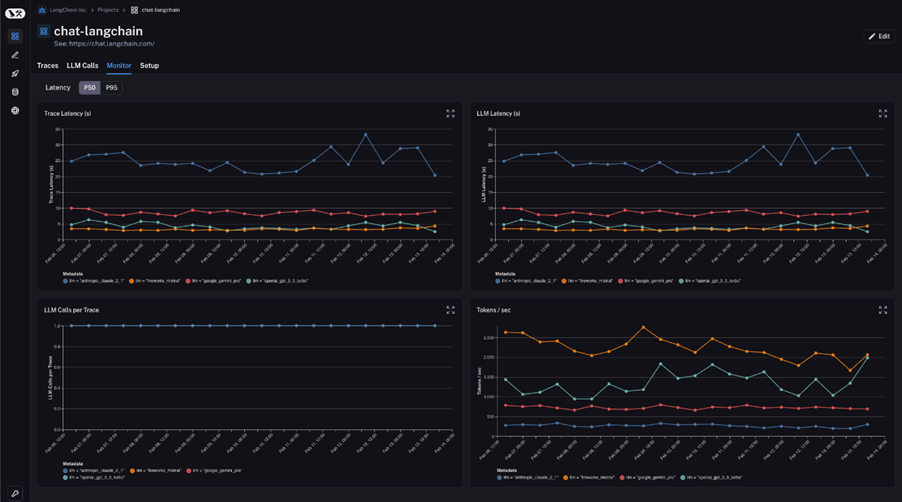
Efficiency metrics require external tooling for full visibility. Self-hosted n8n instances can send traces to LangSmith for automatic token counting, latency breakdowns, and cost estimates per LLM call. Some providers like OpenRouter offer built-in token statistics — create separate API keys per agent to track usage independently.
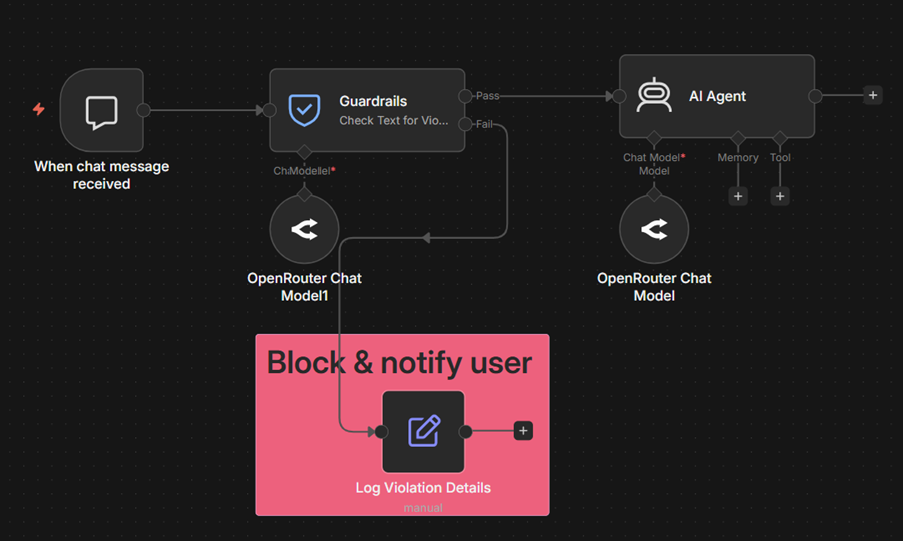
Safety metrics are tracked through the Guardrails node, which routes violations to a separate workflow branch. On that branch, increment a counter in a Data Table per violation type (jailbreak attempt, PII detected, blocked content). Query the table to track violation patterns over time. For escalation tracking, tag every human-in-the-loop branch trigger with the Execution Data node and monitor escalation rate as a percentage of total executions.
Wrap up
Not every agent needs all metrics at once. The right combination depends on your use case, your stage of deployment, and the questions you're actively trying to answer.
In this article we covered four categories of agent metrics:
- Execution metrics: task success rate, latency, and tool call count as your baseline health indicators;
- Quality metrics: accuracy, hallucination rate, and schema compliance to measure whether outputs are correct and usable;
- Efficiency metrics: token usage and cost per task to connect agent performance to business sustainability;
- Safety metrics: policy violations, restricted actions, and escalation rate to verify the agent stays within bounds.
The principle behind all of them is to track what influences decisions. Start small, expand when specific questions demand answers.
What's next?
Metrics define what to measure and connect to how you build your agent, how you debug it when something goes wrong, how you evaluate its performance systematically and how you monitor it at scale.
These guides walk you through each stage — from building reliable agents to catching failures early on:
- How can I make AI Agents more reliable and restrict the actions they can take?— proactive controls that reduce failures before they happen;
- How to Debug Failures or Missteps in AI Agent Behavior? — finding and tracing problems when they occur;
- How to evaluate the performance of AI agents — systematic testing with test datasets and quality scoring;
- Production AI Playbook: Evaluation and Monitoring — building evaluation and monitoring pipelines end to end.
For a broader look at LLM evaluation methods read practical evaluation methods for enterprise-ready LLMs.
Try n8n yourself
- Explore the AI integrations catalog to see available models and tools
- Get started with n8n and start tracking what matters for your AI agents.