Google Spreadsheet is great: it is free, cloud-based, and has a shallow learning curve.
This has made it the go-to solution for:
- small businesses
- solo entrepreneurs with limited budgets
- teams with little or no technical know-how
- and teams seeking to quickly prototype a product.
How these teams use Google Spreadsheets could range from the basic data organization to being the persistence layer in a product. When used as a database, the common dilemma had always been how to display data from Google Spreadsheet on a website.
If you are reading this then you are probably in that muddle.
This article will help you get unstuck. It will demonstrate how to pull data from a Google Spreadsheet to HTML and to begin, let’s start-off with the one question that matters.
How do I pull data from Google Spreadsheet to an HTML table?
You can pull data from Google Spreadsheet to HTML table in at least two ways: with Google App Script or with n8n workflows.
The first method employs Google App Script, a Google service. This approach requires writing some JavaScript code that could pull data from Google Spreadsheet to a website. Evidently, this approach is not ideal for non-technical persons as it requires some coding experience.
Can this be done without needing to write any code — you might ask?
Yes.
The second approach uses n8n to set up an automated workflow that realizes our goal with no code. It just requires connecting the Google Sheet and Create HTML nodes that would work together to pull data from google spreadsheet to HTML.
Wrapping one’s mind around setting up n8n workflows for the first time could be overwhelming, but it is worth it.
Below, I’d demonstrate both approaches, and in the end, you’d see how n8n radically simplifies things.
Use Google Apps Script to pull data from Google Spreadsheet to HTML
For the uninitiated, Google App Script is a cloud-based service that allows you to write custom JavaScript, called scripts that interact with Google products like your Gmail, Google sheets, Google docs etc. It adds an extra layer of custom functionalities to these products.
For example, you could implement web scraping with Google Apps Script or even a chatbot.
While the possibilities are endless with Google Apps Script, more germane to this piece is how we could generate an HTML table from spreadsheet data with this tool. Take the following steps to do that.
Step one: Prepare the Google Spreadsheet data
- Make a copy of the Google Spreadsheet data here. It’s a list of users with their first and last names.
Step two: Create a new Google Apps Script project
- Visit script.google.com and at the top left, click New Project. Notice how the interface you landed on has the Files, Services, Libraries tabs, and code.gs file
Step three: Setting up the project
- Next, we need to enable communication between our project and Google Sheets:
- Go to the Services tab and click the + icon
- Select Google Sheets API from the list in the Add a service popup box. And click Add
Step four: Add the code snippets
- Copy the snippet below and paste it into the code.gs file
function doGet() {
  return HtmlService.createTemplateFromFile('Index').evaluate();
}


function getData(){
  var spreadSheetId = "1wNk3LhnXqI66Z9-RMzBe7vIsog765Tq6LTaLasMn1R4";    //REPLACE WITH YOUR ID
  var dataRange     = "Data!A2:B";

  var range   = Sheets.Spreadsheets.Values.get(spreadSheetId, dataRange);
  var values  = range.values;

  return values;
}
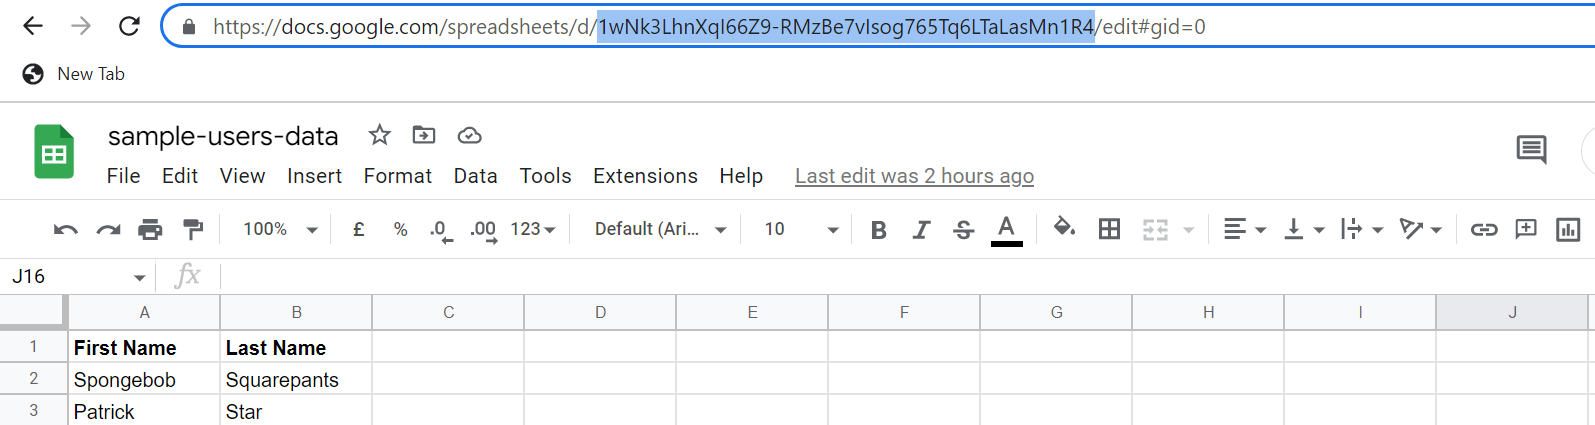
Make sure to replace spreadSheetId with your correct ID. You can grab your spreadsheet’s ID from your browser’s URL bar. See highlighted part of the image below.
- Next, Go to the Files tab and click the + icon → Select HTML → name the file Index → and press your enter key.
- Copy the snippet below and paste in the generated Index.html file
<!DOCTYPE html>
<html>
  <head>
    <!-- Loading datatables, a JS library from the CDN -->
    <script src="<https://code.jquery.com/jquery-3.5.1.js>"></script>
    <link rel="stylesheet" type="text/css" href="<https://cdn.datatables.net/1.12.1/css/jquery.dataTables.css>">
    <script type="text/javascript" charset="utf8" src="<https://cdn.datatables.net/1.12.1/js/jquery.dataTables.js>">
    </script>


    <script>
      /*
      * The line below invokes the getData() function in the Code.gs file,
      * It passes the returned data to showData() function
      */
      google.script.run.withSuccessHandler(showData).getData();

      // This function leverages the JS datatables lib to render our table to the DOM
      // using the data the function receives
      function showData(dataArray){
        console.log()
        $(document).ready(function(){
          $('#table-data').DataTable({
            data: dataArray,

            columns: [
              {"title":"First Name"},
              {"title":"Last Name"}
            ]
          });
        });
      }
    </script>
  </head>

  <body>
    <div>
      <table id="table-data">
          <!-- showData() function defined above would inject table data here -->
      </table>
    </div>
  </body>
</html>
Step five: Deployment
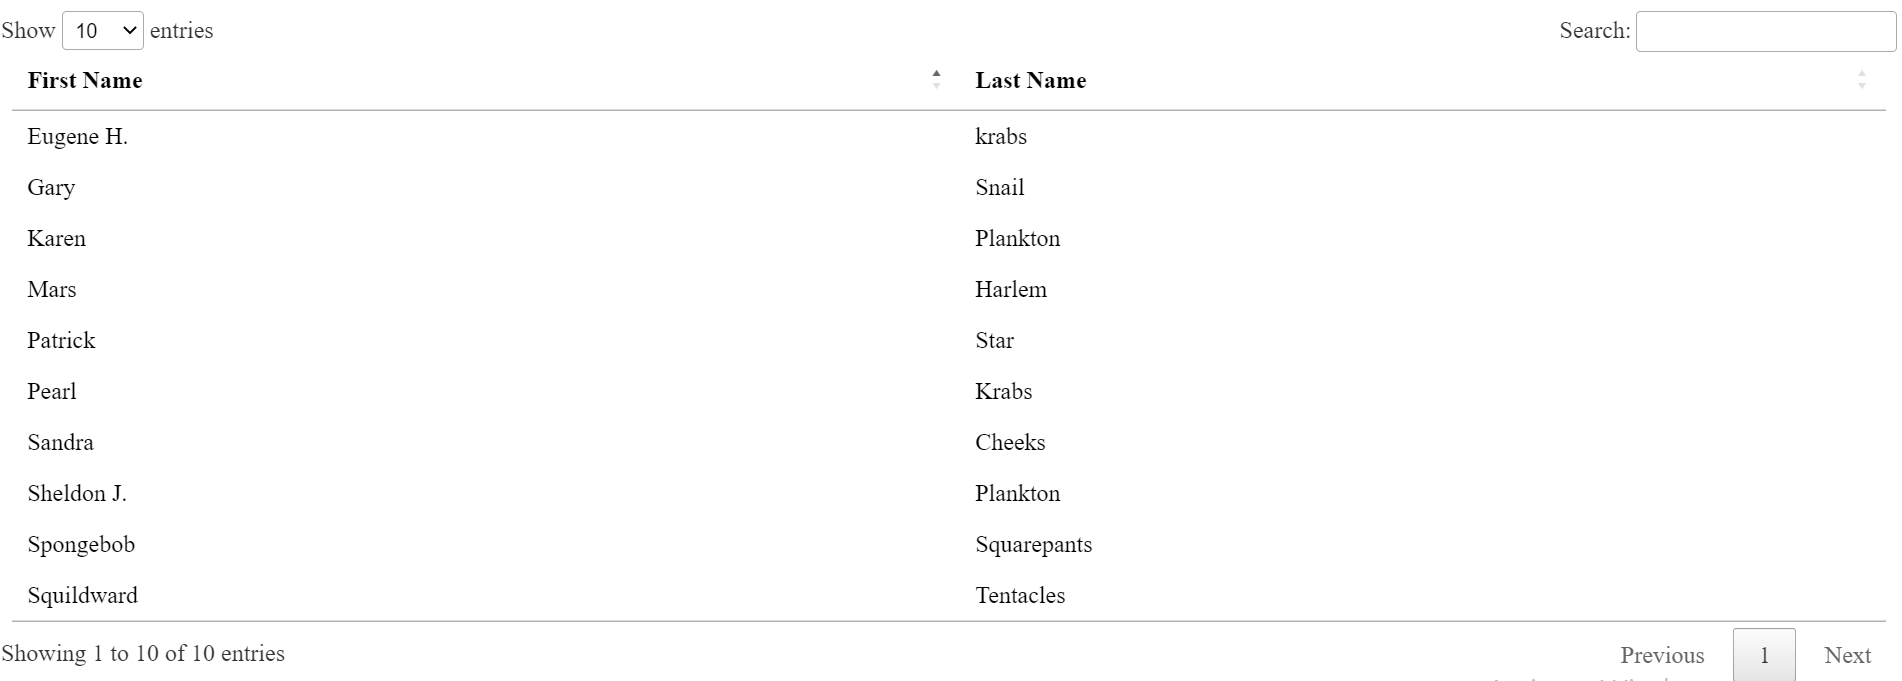
- Next, click Deploy → Test deployments → Click on the generated URL
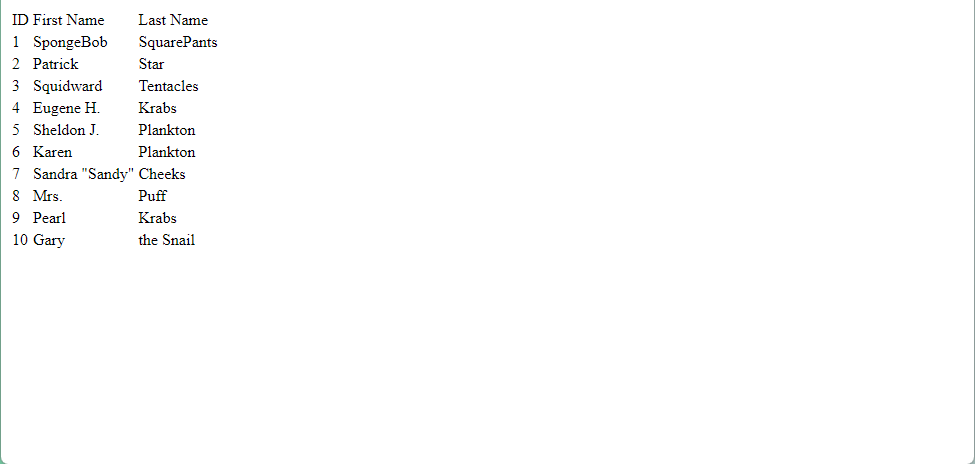
- You should see your table displayed as shown in the image below.
While one could pull data from Google Spreadsheet to HTML with Google Apps Script, as mentioned earlier, this approach requires writing some code.
Use low code n8n to pull data from Google Spreadsheet to HTML
Let’s quickly see how n8n simplifies everything by presenting us with a no-code approach to doing this same thing.
Prerequisites
- n8n set up. The easiest way to get started is to sign up for n8n cloud but you can also self-host n8n.
- Google Sheet with a header row and some data in it. Reuse the Google Sheets data you copied in the previous section.
- Google Sheet ID. This step has been demonstrated in the previous section.
With all the prerequisites set, take the following steps to set up and run an n8n workflow that would pull data from Google Spreadsheet to HTML.
Step one: Spin up an n8n instance
Here I’d be spinning up an n8n instance with docker. If you are also using docker, visiting http://localhost:5678 should take you to the editor UI.
Step two: Importing the workflow
Here, we’d be importing the n8n’s Google Spreadsheet to HTML workflow that would automate (in the sense of 0 code) the task we just demonstrated with Google Apps Script. To do that:
- Click on the Use workflow button using the Google Spreadsheet to HTML. That action would copy the workflow to your clipboard.
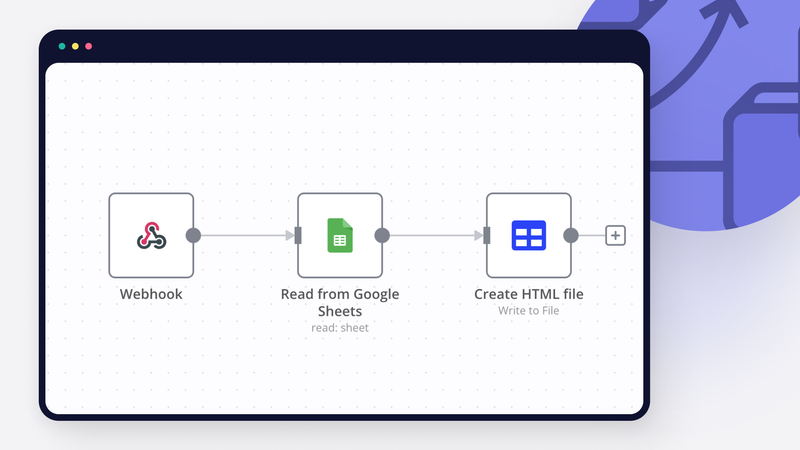
- Go to your n8n instance’s editor UI and paste the copied workflow. Your editor UI should be updated with the workflow as shown in the image below.
The workflow above has three nodes:
- the Google Sheets node that reads data from our spread,
- the Create HTML file node that generates an HTML table using the data received from the Google Sheets node,
- Webhook node.
While the Google Sheets and Create HTML nodes are self-explanatory, the webhook node might not be for first-timers. You can wrap your mind around the basics of webhooks here. And then you can take a more in-depth look at the webhook node here.
Step three: Configuration
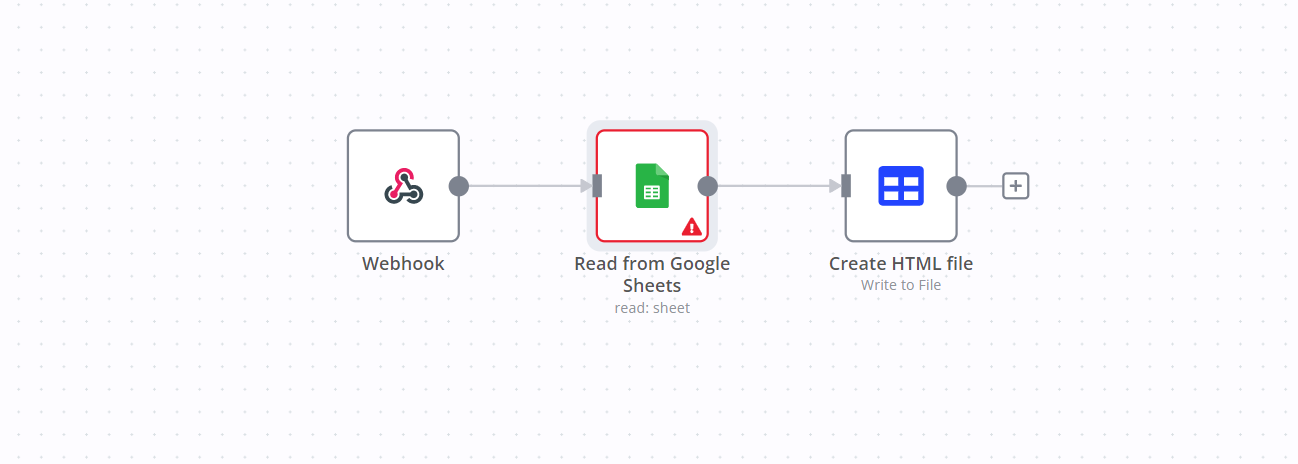
- Notice how the Google Sheets node is highlighted in red. We need to configure it. Configuring this Node entails adding your Google Account credentials to that node. See how to enter credentials for the Google node.
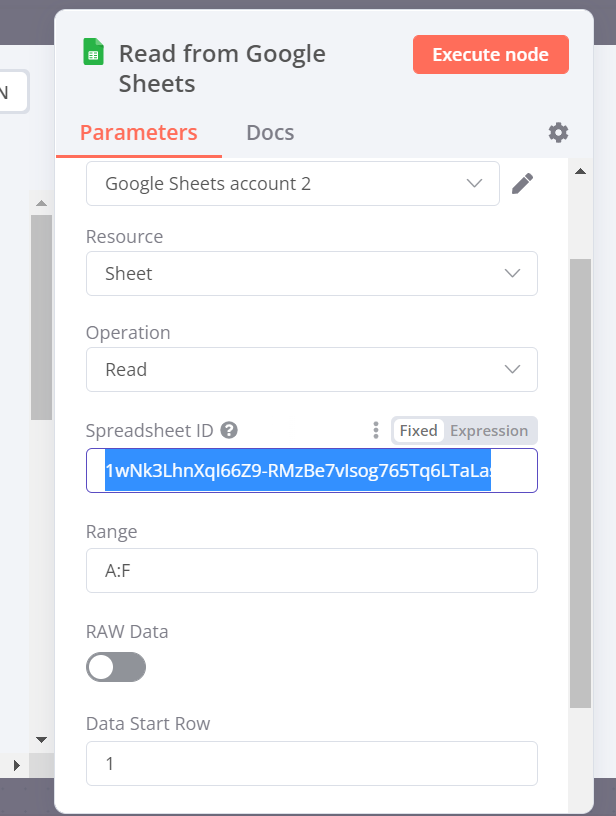
- With your credentials added, add your Spreadsheet ID (refer to previous steps) to the Google Sheets node as shown in the image below.
Step four: Running the workflow
- Activate the workflow or execute it manually.
- Lastly, visit the URL provided by the webhook node in your browser (production URL if the workflow is active, test URL if the workflow is executed manually) to see your spreadsheet data displayed as an HTML table as shown in the image below.
And that’s it!
Without writing a single line of code we’ve had n8n pull data from Google Spreadsheet to HTML. Now you see how n8n is worth the investment?
Admittedly, the generated HTML table is rudimentary. If you’d want a more powerful workflow that could allow you to customize how your HTML table looks, you should check out this workflow:
What’s next?
This time we zoomed in on how an out-of-the-box n8n workflow could be used to display data from Google Spreadsheet on a website.
However, there is so much that could be done with n8n. For example, you could:
- Transfer data from HTML to Google Sheets.
- Scrape data from a website into Google Sheets.
- Or connect Google Sheets to MySql.
Beyond connecting HTML with Google Spreadsheet, you could also use n8n to automate entire operations within your organization, or quickly spin up an entire no-code/low-code backend solution. With n8n the possibilities are endless.
Wrap up
In this article, you've seen how to pull data from Google Spreadsheet to html in at least two ways: with Google App Script or with n8n automated workflows.
We demonstrated how a task that would usually require some programming experience if carried out with other tools like Google Apps Script could be accomplished in n8n with little or no code.
Ready to turn your routine tasks into automated workflows?
Sign up for the n8n cloud account to easily get started and start automating processes with n8n! The platform also offers hundreds of pre-built integrations and hundreds of automation templates, allowing your team to design the custom workflows you need.