
Running AI agents in production means more than just building them. Your agent might look reliable by design with the right model settings, guardrails in place and clear prompt structure. But when the output doesn’t make sense, you need a way to trace where the logic fell apart.
Then you notice you're fixing the same issues over and over instead of catching them with a proper evaluation system. To measure what matters and track the output quality, you need the right metrics. Monitoring adds long-term visibility into your agents’ behavior and lets you see how the numbers change over time.
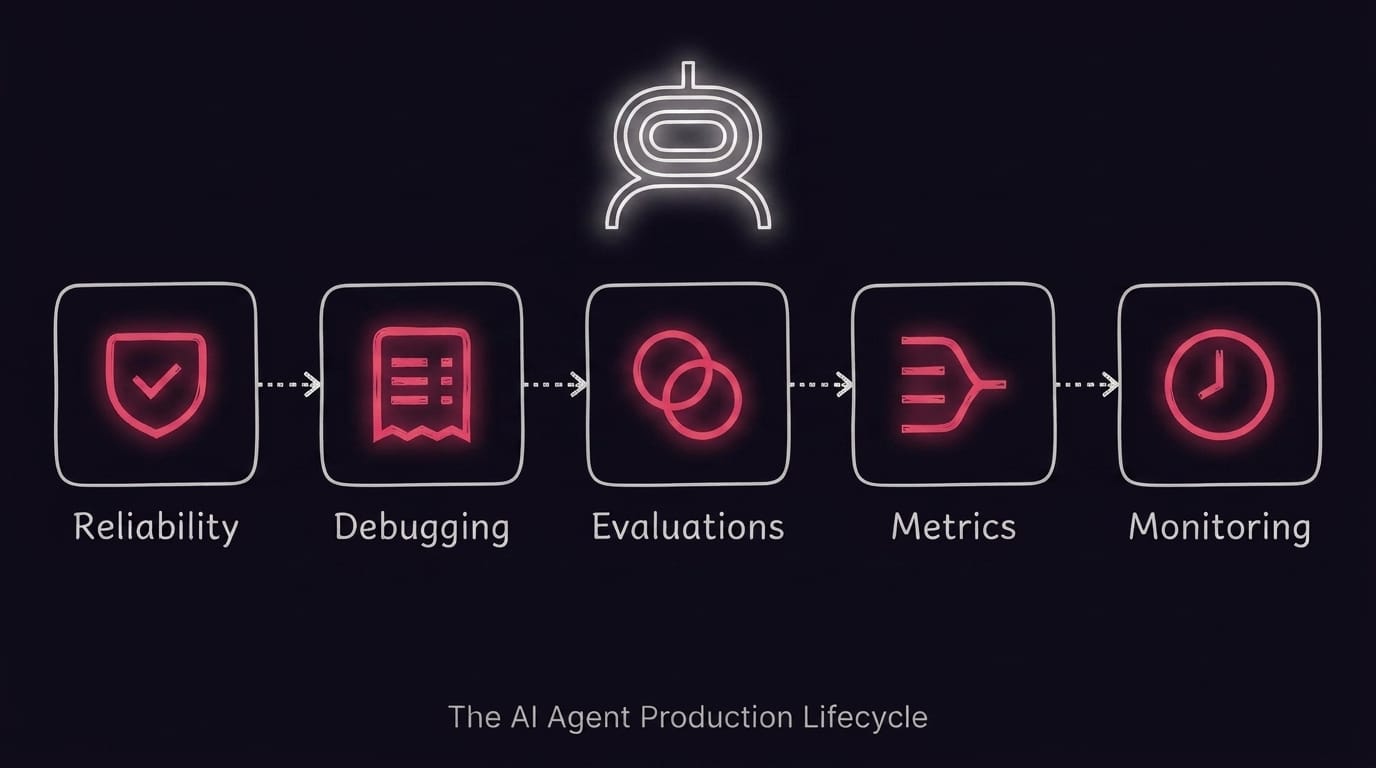
Each of these stages serves a certain purpose and builds your production confidence. This series covers all five for different stages of the agent lifecycle:
- Make agents reliable — model settings, prompts, schemas, guardrails, and routing logic
- Debug failures — execution tagging, built-in traces, and external tracing platforms
- Evaluate performance — test datasets, metrics, and user feedback
- Track metrics — execution, quality, efficiency, and safety
- Monitor in production — operational dashboards and behavioral visibility
The articles are self-sufficient but stand where they are for a reason: first you build controls, then learn to find issues, test them systematically, track the right signals, and watch them over time.
How can I make AI Agents more reliable and restrict the actions they can take?

Most agent failures come from what the agent received as a context, rather than what the model can do. If your agent hallucinates, the first question to ask is if it had the right data.
This article covers techniques that give you control over agent behavior at multiple levels. You'll learn how to get consistent outputs at the LLM level, how to design and configure agent’s tools, how to structure prompts that give the agent clear context and how to write output schemas for predictable formats.
In n8n, these layers turn into specific workflow decisions on how you configure your AI Agent node, where you place Guardrails and IF/Switch nodes for conditional routing, and how you scope tools per workflow stage.
If you've ever watched an agent do something confidently wrong and had no idea which layer to fix, start here.
How to debug failures or missteps in AI agent behavior?
Debugging AI agents is a different game compared to deterministic workflows. There's no error message when the agent makes a bad decision somewhere in its reasoning chain.
This article illustrates three debugging techniques: finding the right execution among hundreds, tracing what the agent saw and decided at each step, and going deeper with external platforms for token-level cost and latency analysis.
In n8n, the first two techniques are built in, with execution tagging through the Execution Data node and full input/output inspection in agent logs. The third one extends to LangSmith or LangFuse for self-hosted deployments.
How to evaluate the performance of AI agents?

Every prompt change, every new tool, and every model swap bring a risk to output quality. Without systematic testing, it’s hardly clear if these tweaks improved your agent or weakened it since there is no reference point.
A few principles that hold regardless of tooling:
- Start with a small, well-chosen test dataset to cover your critical paths
- Run evaluations every time a prompt or tool changes
- Add real production failures to your test dataset as they appear
- Combine offline testing with online evaluation; the first one catches agent drift after any updates, the second one identifies new issues from live data
This article covers how to put these into practice and apply testing of agent outputs before and after deployment. You’ll learn how to choose evaluation methods that match what you're measuring, know which approach fits your current stage, from ad-hoc spot checks to fully automated CI-integrated pipelines, and build evaluation workflows you can run on every change.
AI agent performance metrics: what to track and why

The temptation to track everything is huge: success rates, latency, token counts, quality scores, costs. But every metric you add needs maintenance. The key point is to track only those metrics that will influence your decisions – if you won't change anything based on a number, you don't need to measure it.
This article organizes metrics into four categories based on what they track: execution, quality, efficiency, and safety. You'll learn what each metric identifies, what warning signs to watch for, and how to match your tracking to your current stage. A prototype and a production agent serving thousands of users need very different levels of visibility.
In n8n, execution metrics come natively from the Insights dashboard. Quality tracking runs through the Evaluations feature. Efficiency and safety require targeted instrumentation with the Execution Data node, Guardrails node, and Data Tables.
How to monitor usage and performance of AI steps
Agents don't behave the same over time. Even without changing a prompt or swapping a model, the outputs shift because of new user patterns, external APIs return data in different ways, and conversation histories grow in unexpected ways.
The final article covers ongoing visibility into your agent workflows at two levels: operational monitoring for system health and behavioral monitoring to see what's happening inside the agent's decision-making.
You'll learn how to use n8n's built-in Insights dashboard and Prometheus endpoint for operational monitoring, how to log agent outputs in a structured way, how to track memory state for compliance and debugging, and when to add external platforms like LangSmith or LangFuse for AI-specific observability.
What's next?
With reliability controls, debugging tools, evaluations, metrics, and monitoring in place, you have what you need to run AI agents in production with confidence. Where you go next depends on where you are on your journey.
Start here:
- How to build your first AI agent – the basics of creating AI agents in n8n
Prepare to scale or go deeper:
- 15 best practices for deploying AI agents in production – infrastructure, security, and deployment strategies
- Multi-agent systems – coordinate multiple specialized agents for complex tasks
- Practical evaluation methods for enterprise LLMs – advanced evaluation techniques beyond n8n's built-in features
Try n8n's AI capabilities yourself:
- Explore the AI integrations catalog to see what tools your agents can connect to
- Browse AI workflow templates for ready-to-use examples
- Get started with n8n